
This post has been republished via RSS; it originally appeared at: Microsoft USB Blog articles.
First published on MSDN on Jul 03, 2013Authored by Philip Ries [MSFT]
Last week, at the Microsoft Build Developer Conference-2013 , a new Windows Runtime API ( Windows.Devices.Usb ) was unveiled for Windows 8.1 Preview . Windows Store apps can now use the new API to communicate with USB devices. For more information, see this video .
In this post, I'll provide some instructions that you might find useful while debugging your app. Follow these instructions on the system that is running your app:
- Install Windows Driver Kit 8.1 .
- Open an elevated command prompt.
-
These commands overwrite any existing file named
UsbWinRT.ctl
. Run these commands by pasting them in the elevated command prompt window:
set _NT_SYMBOL_PATH=SRV*http://msdl.microsoft.com/downloads/symbols
echo F849C3C0-E2B0-4FCE-944A-E16EBBB964DC UsbWinRT > UsbWinRT.ctl
echo EF201D1B-4E45-4199-9E9E-74591F447955 WinUsb >> UsbWinRT.ctl
"%PROGRAMFILES(X86)%\Windows Kits\8.0\Tools\x64\traceview.exe"
The preceding commands,
- Set up the Microsoft public symbol server path.
- Generate a CTL file that contains the specified control GUIDs of the trace providers. In this case, those GUIDs indicate Windows.Devices.Usb and WinUsb . In the generated UsbWinRT.ctl file, each line contains the GUID and a friendly name of the provider. We’ll use the CTL file in the following instructions.
-
Launch
TraceView
that allows you to capture trace messages. On non-x64 systems, you must change the last line to
"%PROGRAMFILES%\Windows Kits\8.1\Tools\x86\traceview.exe".
-
In TraceView, check the symbols by selecting
Options -> Configure Symbols
. If not included, add
http://msdl.microsoft.com/downloads/symbolsto the symbol path and click OK . -
Click
File -> Create New Log Session
.
- Click Add Provider .
- Select CTL (Control GUID) File .
- Click the ... button and select the UsbWinRT.ctl file that was created by using the commands in step 3.
-
Click
OK
.
- Close the Format Information Source dialog by clicking Cancel .
- Click Next and then Finish on the next page. The trace session starts automatically.
- Run your app and perform the actions that you want to capture.
-
View trace messages in Traceview.
The messages shown in Traceview are debug trace statements for the trace providers specified in step 3:


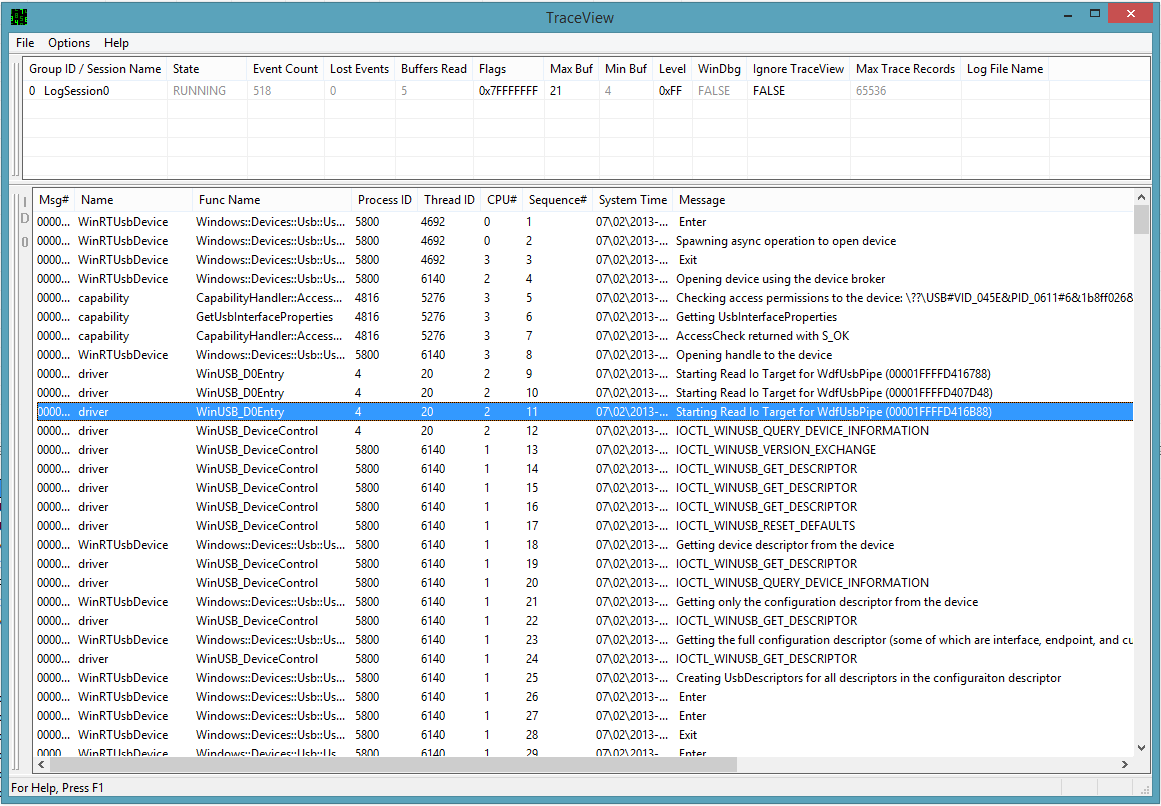
If you are trying to analyze errors originating from the device, it's best to use a USB ETW trace or a hardware bus trace.
Happy coding!