
This post has been republished via RSS; it originally appeared at: Microsoft USB Blog articles.
First published on MSDN on Nov 08, 2013
Authored by Andrea Keating [MSFT] & Eliyas Yakub [MSFT]
[Updated 4/24/2017 with new download location)
The new Microsoft Message Analyzer (MMA) is now available. You can use MMA to capture and view ETW traces, all from a GUI instead of capturing traces by using the command line tool, logman, and then parsing them in Netmon 3.4 .
Here are some key links:
· Download location
· Documentation
· Video tutorial
Let’s see how we can use MMA to capture and analyze USB-specific traces.
Step 1: Install and launch Microsoft Message Analyzer
Download and install MMA. After downloading, follow the install prompts and select Update items .
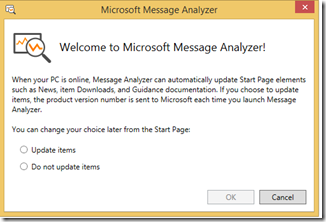
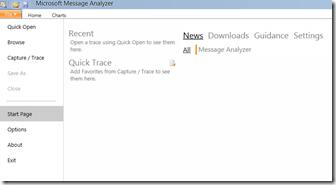
After the installation completes, the tool launches and the start page is shown as seen in this image:
Step 2: Set up an ETW trace capture
1. On the left panel select Capture/Trace . On the right side you’ll see trace scenarios appear as the trace providers are detected. This might take several seconds. The trace scenarios are categorized by Devices , System , and so on.
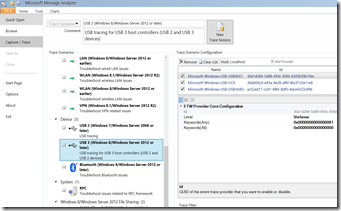
2. Under Device , choose between USB 2 or USB 3 tracing scenarios. Note that USB 3 tracing is only available on Windows 8 and later versions. Make your selection based on the host controller to which the device is connected, not the speed of the device. For example if you have a high speed device connected to an xHCI controller, choose the USB 3 trace scenario.
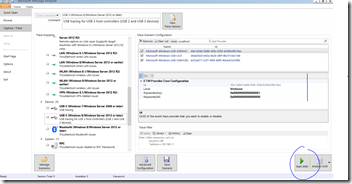
3. Notice the Trace Session and comments that are populated automatically. You are now ready to start tracing.
This images shows the trace scenario options:
Step 3: Select the keywords
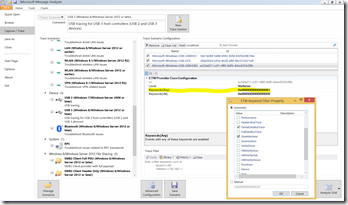
By default, certain trace levels and types are selected to get you started. If you want to control the tracing level (such as Information, Error, Warning, etc.,) and the type of events captured, select Keywords (Any) line as highlighted in this image. If you intend sending the trace file to Microsoft for analysis, we recommend that you include the State Machine keyword for the Microsoft-Windows-USB-USBHUB3 provider.
Step 4: Start tracing to capture logs related for the issue
To starting tracing, click the Start With button on the lower right. Next, reproduce the issue for which you are trying to capture logs.
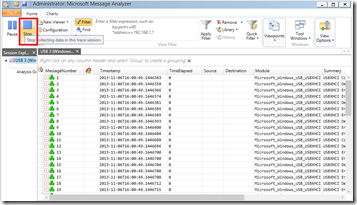
Step 5: Stop tracing
After you are finished reproducing the issue, stop tracing by clicking the Stop button in the upper left hand corner of the Home screen.
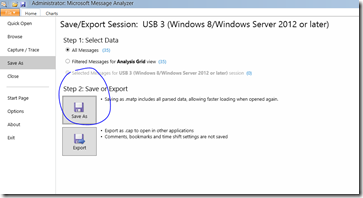
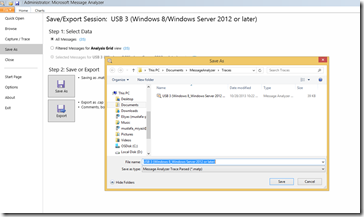
Save the logs that were created during the session by using the save icon on the top left. Select the Save As option. The log file can be shared for analysis.
Step 6: Analyze the captured trace
MMA parses the information dynamically as it is captured and displays them in a human-readable form. In addition, to the default columns shown below, you can add more USB protocol specific columns. To do so, click the Choose Columns menu and scroll to UsbSpec container in the Column Chooser pane on the right. Expand a specific message type and choose one of the listed columns by right-clicking it.
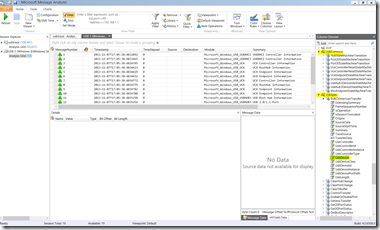
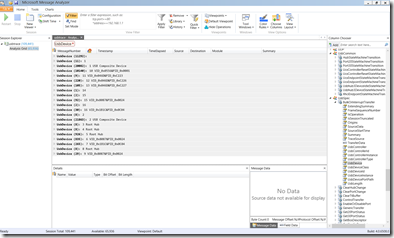
We recommend that you choose UsbDevice as one of the columns and group messages for per device by right-clicking the column. That grouping gives you a detailed view of each device in the trace as shown below.
This blog is a just quick overview about how to analyze traces. Check out these videos that demonstrate how to use the analyzer to diagnose issues.