
This post has been republished via RSS; it originally appeared at: Core Infrastructure and Security Blog articles.
First published on TechNet on Aug 27, 2018
Hello again everyone! Christopher Scott, Premier Field Engineer here. Recently I have been developing a lot of data insight reports for various datasets and customers and thought I would wrap them up and share the wealth.
The first report template I am sharing was made to provide a general overview of the SCOM environment. Below are some important configurations that can be tailored to your environment as well as an outline of the various pages and the data represented within them as well as the download links for the template and PowerBI desktop:
Template can be downloaded from https://gallery.technet.microsoft.com/SCOM-Overview-Dashboard-fd37a6f3
PowerBI Desktop can be downloaded for free from https://powerbi.microsoft.com/en-us/downloads/
Important Configurations:
Data-Source Parameters:
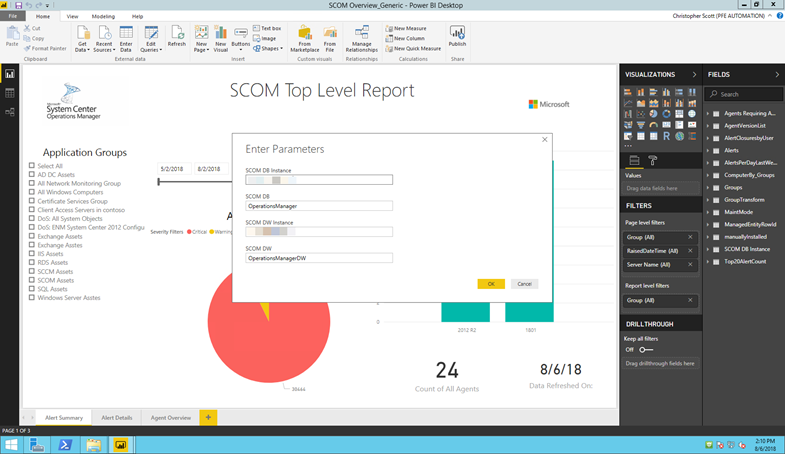
If you are importing from the template file you will be prompted for the "SCOM DB Instance", "SCOM DB", "SCOM DW Instance " and " SCOM DW ". Fill these fields with the appropriate SQL information for your environment and click ok.
If you are using the PBIX file:
Once you open the PowerBI file the first thing you will need to do is configure the data source by editing the parameters. You can do this simply by clicking the "Edit Queries" button on the Home Toolbar and then selecting "Edit Parameters"

Replace the "SCOM DB Instance", "SCOM DB", "SCOM DW Instance " and " SCOM DW " fields with the appropriate SQL information for your environment and click ok. Continue to click OK or Run to allow the Native queries to run and import the data.
Conditional Columns:
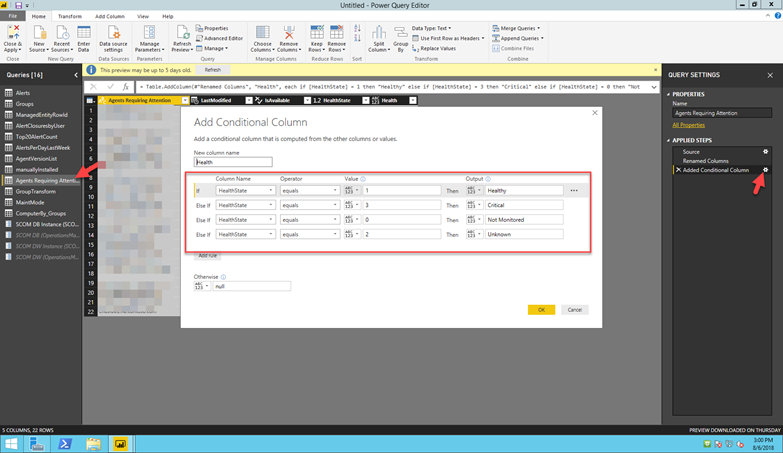
There are 3 tables that we have implemented conditional columns to generalize or group data for easier viewing. These settings may need to be altered to meet your needs. Agents Requiring Attention: I use a conditional column here to translate between different health state codes into a friendly name. Below I outline where to find the specific settings.

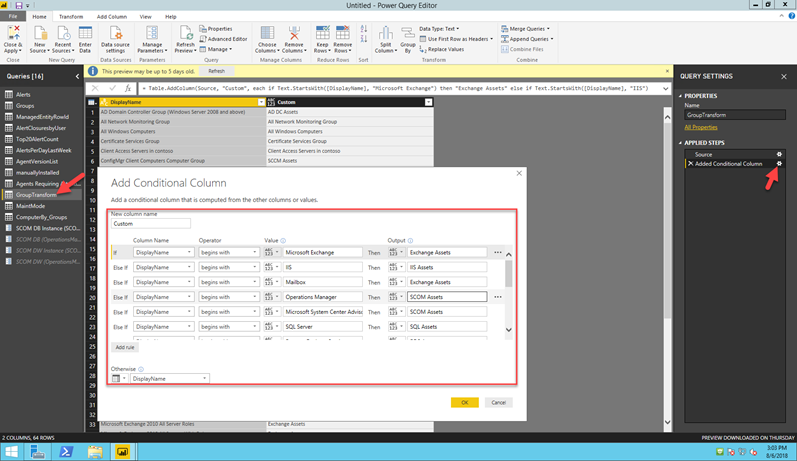
Application Group Transforms: To limit the number of redundant groups listed ion the filter views we created a conditional column to group like groups by display names. These will most likely need to be edited to fit the needs of your environment. Access to these settings are outlined in the images below. 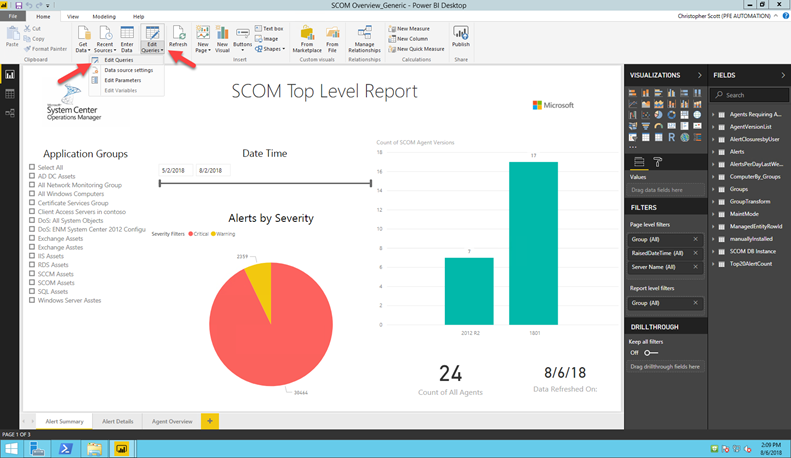
Report Previews:
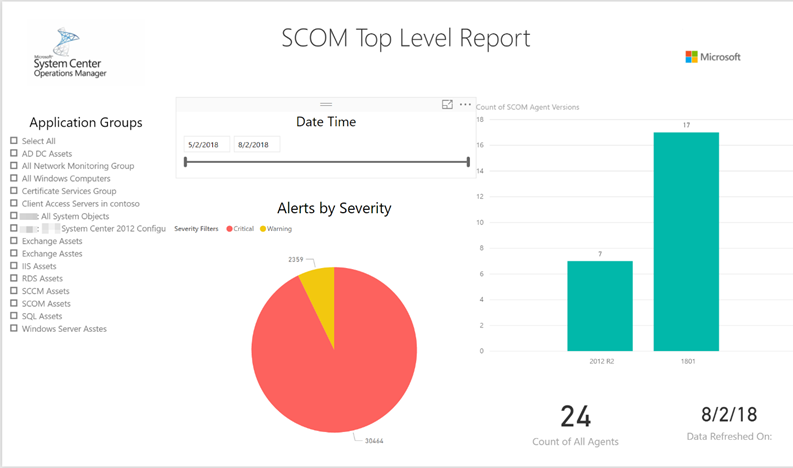
- Page 1 is a General Overview page consisting of 2 filters, a date slider and application group filter that is derived from the Management Groups within SCOM. Also, on the page is pie chart showing alerts by severity for critical and warning only. A bar graph outlining agent versions within the environment (See important configurations for details). On the bottom right I've added a last refresh timestamp for those of you without PowerBI gateways to schedule refreshes.
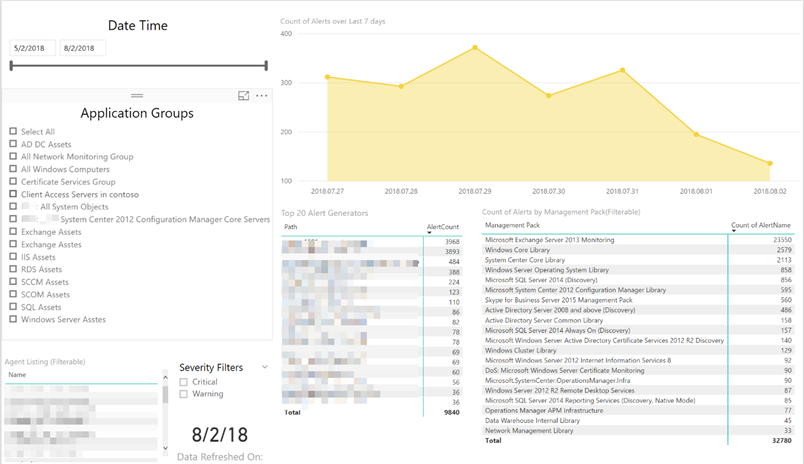
- Page 2 is a Alert Summary details page. On this page of the report I carried over the filter visuals from page 1(See Important configurations for details). The page also has an alert severity filter for additional scoping, an agent list on the bottom right will give a visual representation of the filtered objects(Computer FQDN's). At the top right of the page is a Count of Alerts over the last seven days for trending data. The other two visuals depict Top 20 alert generators and alerts by SCOM Management Pack.
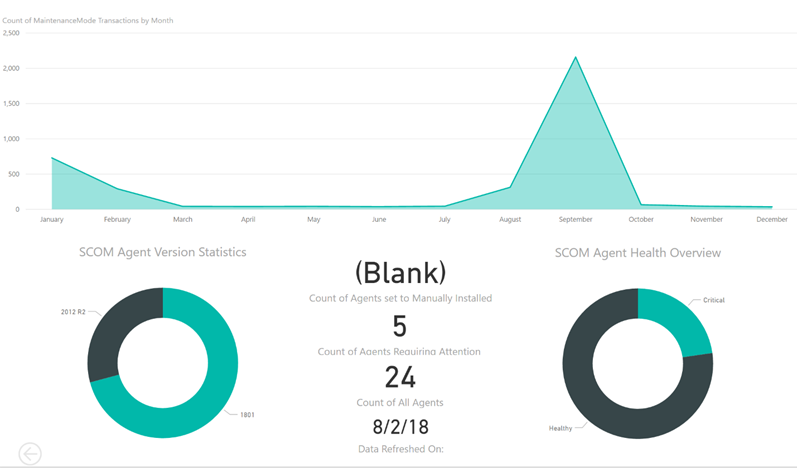
- Page 3 the last page of the report provides agent summary data including the total number of agents, agents requiring attention and those set to manually installed along with visual representations of systems going in and out of maintenance mode over the last year, agent health and version statistics.
I hope these reports give you the necessary data points to empower your organization. Please feel free to comment below with any feedback or ideas that you would like to see templated or improved. I also want to thank some fellow PFE's in the SCOM field so shout out to Ted Teknos, and Mark Hawver for your guidance and insight into what data is valuable and what is not.
Thanks for reading!