
This post has been republished via RSS; it originally appeared at: Microsoft Research.

It was crunch time, just as it had been many times before in the preceding weeks. Such is the nature of real-time competition. The yearlong Subseasonal Climate Forecast Rodeo was being sponsored by the Bureau of Reclamation and the National Oceanic and Atmospheric Administration, and teams were tasked with predicting temperature and precipitation in the Western United States for two time spans—two to four weeks out and four to six weeks out. Teams were required to submit their four predictions every two weeks.
Waiting until the day before the submission deadline, as they often did to base their predictions on the most up-to-date information possible, Microsoft Researcher Lester Mackey and his teammates pulled up their data source and found—nothing. The data wasn’t there.
It took some time to reach competition organizers, who told them the data had been moved and provided a new link, but any hope of an extension was extinguished upon making contact. Organizers reminded the group that missing and incomplete information is among the challenges facing real-world forecasters. (I mean, how often have you seen your local meteorologist skip a prediction because of insufficient information?) The disappearing act set the team back 12 hours.
“That was a painful day,” recalls Mackey. “We submitted something. It wasn’t very good.”
Data is the driving force behind many research areas, the engine that powers progress, especially in statistical machine learning. This challenge, though, was unique in that data collection was mainly the responsibility of the teams, organizers providing only the sources they would use for judging the competition. Mackey and his teammates scoured different sources, including government websites, compiling the variables they thought were most important. There were quite a few times when the data wasn’t released on schedule or at all.
Despite the obstacles, Mackey and his teammates—climatologist Judah Cohen of Atmospheric and Environmental Research, a Verisk business; professor and consulting researcher Ernest Fraenkel; and graduate students Jessica Hwang and Paulo Orenstein—excelled. They placed first in predicting temperature for Weeks 3 and 4 and second for predicting precipitation for Weeks 5 and 6 in the competition, developing not only a machine learning-based forecasting system but also a comprehensive dataset for training subseasonal forecasting models. The dataset is available now via the Harvard Dataverse. The group’s work is presented in the paper “Improving Subseasonal Forecasting in the Western U.S. with Machine Learning,” for which the team brought on engineer Karl Pfeiffer, also of Atmospheric and Environmental Research, to help with the historical evaluation.
“What has perhaps prevented computer scientists and statisticians from aggressively pursuing this problem is that there hasn’t been a nice, neat, tidy dataset for someone to just download from the internet and use, so we hope that by releasing this dataset, other machine learning researchers or computer science researchers will just run with it,” says Hwang.
The ‘holy grail’ of forecasting
Today’s forecasters are able to sufficiently predict the short term—think your 10-day forecast—using current atmospheric conditions and are even accurate enough in providing a sense of what we can expect long term, or more seasonally, using land and oceanic conditions. But subseasonal forecasting, which comprises the two-to-six week range? Cohen describes it as the “holy grail of forecasting.”
“That two-to-six-week time frame is kind of in no man’s land; it’s too long a period to have any signal from the conditions today, but it’s too short to really get a signal from the earth’s surface,” explains the climatologist, who brought the idea of applying machine learning to the field and entering the contest to Mackey.
Current models are physics-based simulators governed by a set of dynamical equations dependent on observations of the weather today, such conditions as temperature and humidity, to predict weather tomorrow, says Cohen. The trouble, among other challenges, is weather is fluid, changing across both time and space, and it’s impossible to capture that continuity exactly in simulation. Instead, current simulators are approximations that grid up space and time and make generalizations about larger areas they represent.
But even if we could perfectly simulate a weather model, instrument limitations remain problematic. The most precise instruments are imperfect and cannot simultaneously monitor all aspects of the weather at all locations and all times.
“The physics-based models amplify error so rapidly that even a small discrepancy in the initial conditions leads to highly inaccurate predictions after 14 days,” says Mackey, summarizing the fundamental issue presented by meteorologist and mathematician Edward Lorenz in the early 1960s.
And useful subseasonal forecasting systems matter. Farmers can better plan planting and harvesting; utility companies can call in necessary resources, like additional trucks, sooner; and water and fire management agencies can better address the strains of extreme weather events such as droughts, flooding, and fire. “They can’t make that preparation a day in advance, but with a two-week heads-up, there are preparations they can make,” says Cohen.
According to Mackey and his team, over the years, there was a shift from statistical forecasting to today’s more physics-based approach. But there is a missed opportunity in going solely with those strategies that, as Cohen explains, are more about solving the future dynamics of the atmosphere and less about studying what has already occurred.
“Even though, in theory, there is an infinite number of weather patterns, the atmosphere tends to repeat itself, and that can be exploited in making predictions,” he says.
Enter the data.
A more statistical approach to predicting rain or shine
A large amount of high-quality historical weather data and existing computational power make the exploration of a more statistical approach to forecast modeling worthwhile, and—as the team has shown—merging both the physics-based and statistics-based approaches equals better predictions.
“Machine learning is essentially learning from experience,” says Mackey. “Even though we can’t observe the future, we have many examples of past temperature patterns and the historical features that preceded them. Ample relevant data and the computational resources to extract meaningful inferences are what make machine learning so well-suited to the problem.”
The team’s forecasting system combines two regression models trained on its SubseasonalRodeo dataset. The dataset comprises a variety of weather measurements dating as far back as 1948, including temperature, precipitation, sea surface temperature, sea ice concentration, and relative humidity and pressure, collected from such sources as the National Center for Atmospheric Research and the National Oceanic and Atmospheric Administration’s Climate Prediction Center and National Centers for Environmental Prediction.
The team based the first of its two models—a local linear regression with multitask model selection, or MultiLLR—on the presumption that not every factor in its dataset would be of equal importance at any given time throughout the year. For example, a relevant factor in the wintertime, such as sea ice concentration, might not be as useful in predicting temperature or precipitation in the summertime.
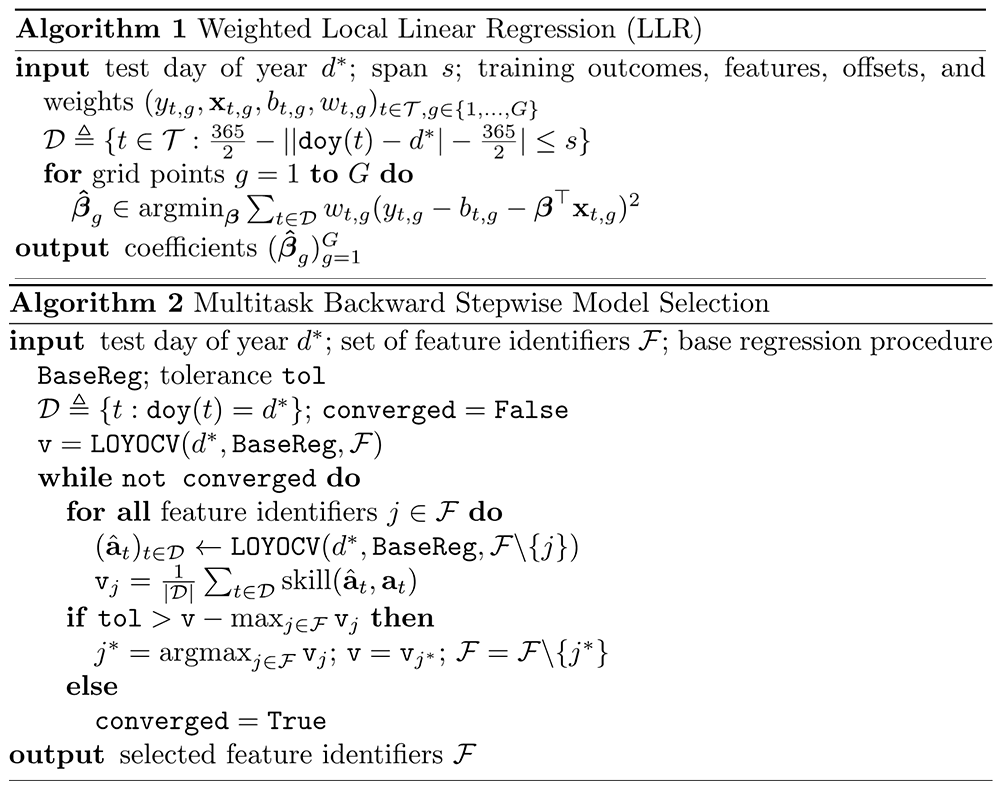
Mackey and his team use a local linear regression with multitask model selection to train one of their two climate forecasting models to evaluate the relevance of a variety of conditions in predicting future temperature and precipitation.
Data used was limited to an eight-week span in any year around the day for which the prediction was being made, and through the selection process, which used a customized backward stepwise procedure, two to 13 of the most relevant features—or predictors—were combined to make a forecast. Also included as a predictor was the prediction of a physics-based model, which the model being trained would take or leave depending on its veracity.
The second model—a multitask k-nearest neighbor autoregression, or AutoKNN—incorporates the historical data of only the measurement being predicted, either temperature or precipitation.
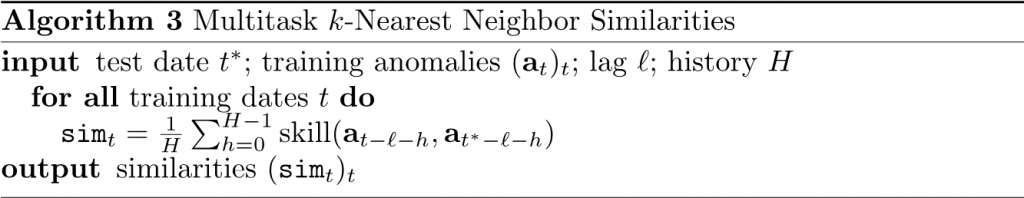
A multitask k-nearest neighbor autoregression focuses on historical data of only the condition being predicted—temperature and precipitation in the case of the Subseasonal Climate Forecast Rodeo.
To make a prediction for a target date in the future, the model first identifies dates in history that bear the most similarity to the target date. Because the target has not yet been observed, the model creates an observable history for the target date based on the observations one year and 60 days through one year prior (for example, November 3, 2017, through January 1, 2018, when forecasting January 1, 2019). The model then judges similarity by comparing the history of the target with the history of each past date. If a candidate date’s history proves to be good a predictor of the target date’s history, then the candidate date’s observed temperature or precipitation, whichever is being predicted, is adopted as proxy for the future date’s.
“We wanted to open up the playing field to any date that could have been relevant, and we found that, quite often, the dates selected weren’t in the same months or seasons as the dates being predicted,” says Mackey.
For temperature, each of the 20 most similar dates produced a prediction for the target date. These 20 predictions were the variables in their regression model, which assigned a weight to each—“think of it as how much I trust each of those predictions,” says Mackey—and then combined them to yield a single and hopefully more accurate prediction. Also, the model biased its prediction function to a time period closest to the target month-day combination, within 56 days to be exact.
“We found that the optimal way to combine neighbors changes based on the time of year,” says Mackey. “The rules that we were learning for combining the 20 dates together into a single prediction looked very different in the summer than in the winter, and so this locality was to capture that, to add a seasonality component to our prediction rule.”
Precipitation, which Lester said was a more difficult prediction task, didn’t benefit from multiple “similar date” variables, so the model used only one.

Distribution of the month of the most similar neighbor learned by AutoKNN as a function of the month of the target
date. Left: Most similar neighbor for temperature, Weeks 3–4. Right: Most similar neighbor for precipitation, Weeks 3–4. For temperature, the most similar neighbor can come from any time of year. For precipitation, the researchers observe a strong seasonal pattern; the season of the most similar neighbor generally matches the season of the target date.
The benefits of ensembling
While each model on its own performed better than the competition’s baseline models—a debiased version of the operational U.S. Climate Forecasting System (CFSv2) and a damped persistence model—they tap into different components of the difficulties in subseasonal forecasting: The first model uses only recent history to make its predictions; the second model doesn’t account for other factors influencing climate and weather. So the team’s final forecasting model was an ensemble of the two. They averaged their normalized anomalies, resulting in a more accurate prediction.
“You can think of each model as being a different expert, so it’s like having a panel of experts and then you might combine their opinions,” says Hwang.
The team believes ensembling has great potential in this space to improve forecast accuracy—or skill, as it’s called in climatology—and mitigate the inherent instability of the objective function. Right now, measuring forecast accuracy involves comparing a map of predictions and a map of “truths” and noting their cosine similarity.
In this work, the team ensembled just two models and for just a small portion of the planet. They hope to expand their work beyond the Western United States and continue to collaborate with the Bureau of Reclamation and other agencies to use statistical machine learning for social good.
“I think that subseasonal forecasting is fertile ground for machine learning development, and we’ve just scratched the surface,” says Mackey.
The post Predicting the ‘holy grail’ of climate forecasting: A new model and a new public dataset appeared first on Microsoft Research.