
This post has been republished via RSS; it originally appeared at: Ask The Performance Team articles.
First published on TECHNET on Aug 09, 2013Good morning AskPerf! This is Digvijay from the Performance team in Bangalore. Following up on my previous blog about Task Manager for Windows Server 2008 R2, it was very apt to write another one about the Task Manager of Windows Server 2012 & Windows 8.
My first impression of this new task manager was – Wow! This is really simplified but is still powerful. Let’s have a look at what’s new:
The first time you open update task manager on Windows Server 2012 / Windows 8, you will be presented with a minimal look:

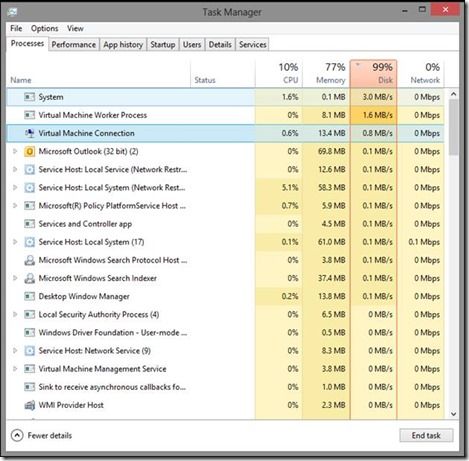
However, clicking “More details” reveals much more…
NOTE the Disk & Network columns do not appear on Windows Server 2012. Network usage can be found on the Performance tab, and Disk activity can be found in Resource Monitor.

At one glance, we can see how any process is doing and what kind of load its adding on the computer. This will come in handy for troubleshooting those slow response issues as just by looking at the task manager, we can now quickly know who’s thrashing the disk and who’s choking up the bandwidth. Memory and CPU are pretty much the same as previous versions.
If you expand the Process, you will see more details about that process. Example - expanding the Background processes shows the services that are running inside it, if any exist.

If you want to stop a service, we can do it right from here. Just right click and select Stop.

We can also open Services snap-in directly from here.
Apart from other enhancements, the other good thing I like about this tab is the Open File Location option when you right click on any of the processes. Please note that the context menus are different for a program and an open window inside it.
Here is an example:
Right click on Microsoft Word –
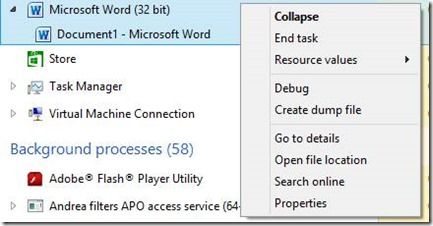
Right click on Document1

The next tab is Performance. This tab has been redesigned and made easier to get all the required information about your computer in one place.

The main heads here are –
- CPU – Shows you all the information you might want to know about your CPU at a glimpse. E.g. The type of CPU on the machine ( the make and model), Clock speed, Total Sockets, Number of Cores, Number of Logical Processors being exposed to the OS as well as if the CPU supports virtualization or not. You also get to know about the L1, L2 and L3 cache present on the machine.
This tab also shows the CPU usage history since the time Task Manager was opened. We also expose information of the total number of Processes, Threads and Handles along with the Uptime of the machine.

- Memory- Again this tab has been modified to show information that is easy to understand and relate. We see the graph of the memory usage of the last 60 seconds since the time the Task Manager was open.
The second graph segregates the amount of pages in the different lists of PFN Database:
In Use
– Memory used by processes, drivers and the operating system.
Modified
- Memory whose contents must be written to disk before it can be used for another purpose.
Standby
- Memory that contains cached data and code that is not actively in use.
Free
- Memory that is not currently in use, and that will be repurposed first when processes, drivers, or the operating system need more memory.
NOTE that this graph shows the same information that’s shown in the Reliability Monitor in Memory section.
This page also shows hardware information about the physical memory like number of RAM slots present on the server and used, the Type of memory bus, the Speed of the FSB and any amount of memory reserved by the hardware. (PCI cards, Graphics, shadowing etc.)
It also summarizes the memory in use and memory available along with committed and cached bytes.
In Use
– The total memory currently used by the OS, the process and drivers running.
Available
- This is amount of physical memory that is currently available for use by the operating system. It is equal to the sum of the standby pages and the free pages from the above graph.
Committed
- Committed memory is the physical memory in use for which space has been reserved in the paging file should it need to be written to disk.
"Not true - if you have no paging file you still have committed memory - committed virtual memory is private, nonshareable virtual memory created by processes or the OS or drives that MAY need to be paged out. This always starts out in RAM and *may* get paged out if necessary. So committed memory can be backed by RAM (and if you have no paging file, it remains in RAM until the VM is deleted such as at process exit).
Even if you have a paging file, space is not reserved for this until such time as it actually DOES get paged out. What Windows *does* make sure is that it doesn't overcommit - meaning private virtual memory allocations are charged against the commit LIMIT (sum of RAM + paging files - though the current commit limit shown in Task Manager or other tools is based on the CURRENT size of the paging file, meaning if paging files are configured to expand [the default when you choose System Managed] that the commit limit will go up as the paging file expands)."
Thanks to David Solomon for this correction and description!
Cached –
This is the sum of the standby and the modified pages as shown in the task manager.
Paged Pool
– Memory allocated in the of kernel mode virtual address space to kernel mode components, device drivers etc. These can paged to the pagefile if there is any need to free up physical pages.
Non-Paged pool
- Memory allocated in kernel mode virtual address space to kernel mode components, device drivers etc which is guaranteed to be resident in physical memory all the time.

- Disk – Shows information about the disk drives connected to the machine. ( You will see one or more disks depending on the number of connected physical drives including USB drives)
The graph shows the percentage disk activity in the last 60 seconds since Task manager was open. The 2 nd graph shows the speed at which data is being read/written to the disk in KB/MB per second.
Here we have information about the make and model of the disk, total capacity and formatted disk space. We also show if a particular disk is a system disk or not (has the Boot files) and if it contains any page file.
Active time
- Percentage of time the disk is busy. The lower the better.
Average response time
– This is the time taken for the disk to complete individual read/write operation. This includes the time required for the spindles to rotate and the head to move and align to the specific sector for reading the content.
Read speed
– Rate at which data is being read from the disk in KB/s.
Write
speed
– Rate at which data is being written to the disk in KB/s.
- Ethernet – Show all the info that you would like to know about your network card.

The graph shows the network throughout of the last 60 seconds since the time the task manager was open. It also shows the current upload and downloads speed along with the type of connection and the ipv4 and ipv6 address.
The next tab is dedicated to the Modern UI apps and shows the history of the recently used apps and the amount of resources they have been using (CPU, Network bandwidth) for different operations like Tile updates, Uploads, Downloads, etc. Depending on the setting for downloading over a metered connection, we can also view those sections detailing the amount of network bandwidth used.

The Startup tab shows what we used to see in msconfig in the older OS’s (Win7/2008R2 and earlier) with better information like the impact of the startup application on the startup/login process. If you are experiencing issues with slow logons, or delays in reaching the desktop, this is the first place you need to visit to check and disable the processes having high/medium impact.

We can also find information regarding the Disk I/O and CPU usage by the processes listed during the at the startup operation.
Continuing on we come to the Users tab:

This tab shows you which users are logged on, and what processes are running under their context. Clicking the Disconnect button will obviously disconnect that user, but not log them out.
Details tab is next:

This Tab is pretty much similar to the Processes tab under XP/2003/Win7/Server 2008. There are some new options available when you right-click a process name:

Finally, we come to the Services tab.

This one is also similar to the same one in Windows 7 / Server 2008. It does add a few additional right-click options however:

We hope you are enjoying the newly designed Task Manager in Windows Server 2012 / Windows 8. If you want to read more about Task Manager, check out the following links:
Windows 8 / Windows Server 2012: The New Task Manager
-Digvijay