This post has been republished via RSS; it originally appeared at: SQL Server Support articles.
First published on MSDN on Dec 06, 2012
This provides a general approach on how to troubleshoot SQL Server I/O-related issues. My belief is that if you truly understand this, you are empowered to solve the disk I/O challenges yourself.
Define slow disk performance:
The metric commonly used to measure slow I/O performance is the metric that measure how fast the I/O subsystem is servicing each I/O request on the average in terms of clock time. The specific Performance monitor counters that measure I/O latency in Windows are Avg Disk sec/ Read , Avg. Disk sec/Write and Avg. Disk sec/Transfer (cumulative of both reads and writes).
From a SQL Server perspective things are no different. We usually look at whether SQL Server reports any I/O bottlenecks measured in clock time (milliseconds). SQL Server makes I/O requests to the OS by calling Win32 functions - WriteFile(), ReadFile(), WriteFileGather(), ReadFileScatter(). When it posts an I/O requests, SQL Server times the request and reports how long that request took. SQL Server uses Wait Types to indicate I/O waits at different places in the product. Examples of such waits are PAGEIOLATCH_SH, PAGEIOLATCH_EX, WRITELOG, IO_COMPLETION. If these waits exceed 10-15 ms on a consistent basis, then I/O is considered a bottleneck.
The Methodology (updated in Jan 2019)
Methodology Summary:
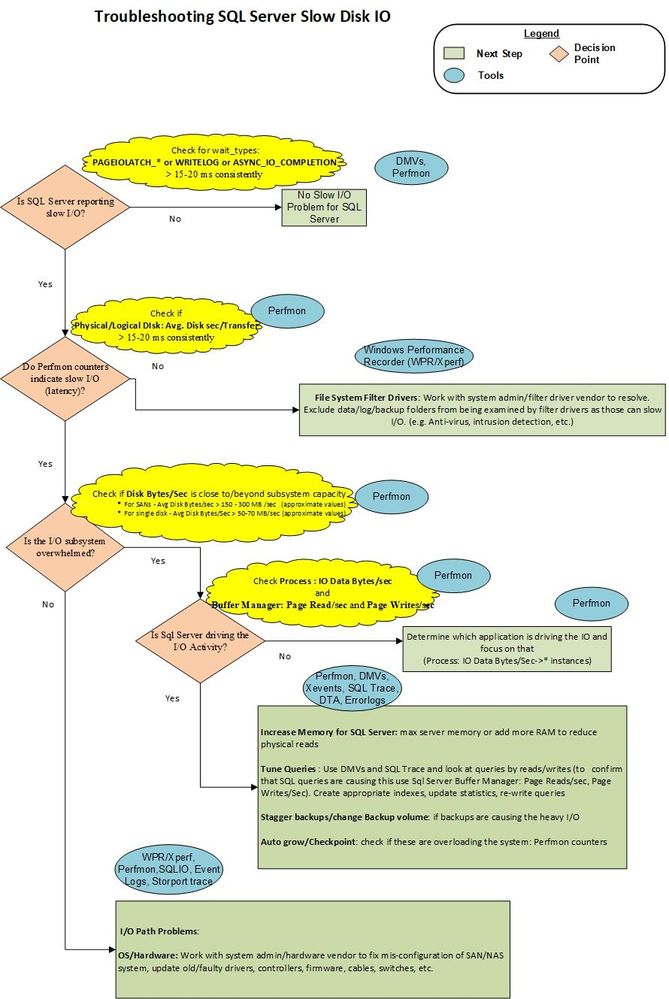
The hope is that the flow chart above is self-explanatory, but here are some notes on it to provide guidance.
1. Determine if there is I/O latency reported by SQL Server wait types. PAGEIOLATCH_* , WRITELOG values , as well as those of several other less common wait types, should generally stay below 15-20 milliseconds per I/O request. If these values are greater on a consistent basis, then a I/O performance problem exists and warrants further investigation.
2.1 If SQL Server reports I/O latency, then refer to OS counters. Determine if there is an I/O problem, by examining the latency counter - Avg Disk Sec/Transfer. If, the values of this counter are consistently above 15-20 ms. then you need to take a look at the issue further. (Occasional spikes don't count in most cases, but be sure to double-check the duration of a spike - if it lasted 1 minute or more, then it is more of a plateau than a spike.)
2.2 If Performance monitor counters do not report latency, but SQL Server does, then the problem is between SQL Server and the Partition Manager (the I/O layer at which the OS collects Perfmon counters); that is file system filter drivers. Ensuring proper exclusions of filter driver and resolving filter driver issues is the next logical step.
3. If I/O subsystem is slow, then find out if that is caused by the system being overwhelmed beyond capacity by looking at I/O volumes - Disk Bytes/Sec or Disk Read Bytes/Sec, Disk Write Bytes/Sec . Be sure to check with your System Admin or hardware vendor on what the expected throughput specifications are for your SAN (or other I/O subsystem). For example you can only push no more than 200 MB/sec of I/O through a 2 Gb/sec HBA card or 2 Gb/sec dedicated port on a SAN switch. The expected throughput capacity defined by hardware manufacturer defines how you proceed from here.
4. If I/O subsystem is overwhelmed beyond capacity, then find out if SQL Server is the culprit by looking at Buffer Manager: Page Reads/Sec (most common culprit) and Page Writes/Sec (a lot less common). If SQL Server is the main I/O driver and I/O volume is beyond what the system can handle, then you need to work with the Application Development teams (or application vendor) to tune queries - better indexes, update statistics, re-write queries, re-design the database, etc. Also, you can consider increasing max server memory, or adding more memory which will allow more data/index pages to be cached and not re-read from disk frequently.
Further Comments:
In general there could be three high-level reasons why SQL Server queries suffer from I/O latency:
1. Hardware issues: There is a SAN misconfiguration (switch, cables, HBA, storage), exceeded I/O capacity (throughout entire SAN network, not just back-end storage), drivers/firmware bug, etc with the disk I/O subsystem and that is where the hardware vendor need to be engaged
2. Query Issues: SQL Server (or some other process in some cases) on the system is saturating the disks with I/O requests and that is why transfer rates are high. In this case we likely need to find queries that are driving tons of Reads (or writes) and tune them to minimize the disk I/O. Using appropriate indexes helps, as well as providing the optimizer sufficient information to choose the best plan, i.e. keep statistics updated. Also incorrect database design and query design lead to increase in I/O.
3. Filter Drivers: SQL Server I/O response can be severely impacted if file-system filter drivers which process the heavy I/O traffic. Proper file exclusions and correct filter driver design is recommended to prevent this from happening.
Namaste!
Joseph

