
First published on MSDN on Apr 07, 2016
You can debug interactively your Node.JS apps on Azure using the built-in Node Inspector. I will walk you through how to set up Node Inspector and debug an Azure Mobile App.
Review
You can debug using the Monaco interface without doing any special setup, however it is not interactive debugging with variable inspection etc. To use the Monaco interface, Go through Easy Tables and select the ‘Edit Script’ icon:

You can edit the script and see the results of errors here when you make a change and hit the play button. In this example you can see I have an error: error: TypeError: Cannot read property ‘id’ of undefined

This may be all you need, however if you want a richer experience, you can use Node Inspector with Azure App Services for a richer debugging experience
Requirements/Checklist
Web Kit enabled browser such as Chrome
Azure Web App or Azure Mobile App using Node.JS backend
Enable WebSockets in the app configuration
Modify the iisnode.yml file on the site
Modify the web.config file on the site
Hit a special URI to start debugging
Note: This will not work for https:// which is required if you are using Authentication (so you would have to disable Authentication temporarily for this to work).
Walkthrough
I created a Node.JS backend based Azure Mobile App called ‘jsandersdebugnodejs’. Monaco was not interactive enough for me so I decided to use Node Inspector built into the Azure Mobile App/Web App.
First step is modify the app settings to allow web sockets and Save:

Next go to Kudu. You can do this through the portal using the Tools icon of your App or simply put ‘SCM’ between the name of you website like this example:
https://jsandersdebugnodejs.scm.azurewebsites.net/
Once in Kudu choose ‘Debug console’ and ‘CMD’ to get to the command line interface (Note – you can use ‘Monaco’ to edit instead if you prefer):

Then click on the ‘site’ and then ‘wwwroot’ folders to navigate to the wwwroot folder (or go old school and type cd site\wwwroot in the command area):
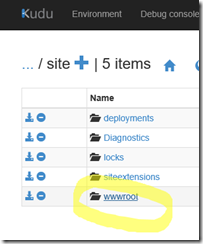
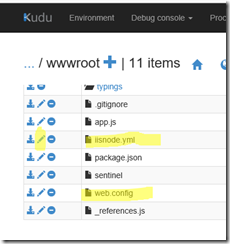
Scroll down and find the ‘iisnode.yml’ and ‘web.config’ files. Click on the pencil icon to edit iisnode.yml:
Add the line: debuggingEnabled: true
and click save:

Now click on the pencil icon for web.config to edit it.
It should already have this rule by default at the top (app.js is the startup script for a Mobile App):
<rules>
<!– Do not interfere with requests for node-inspector debugging –>
<rule name=”NodeInspector” patternSyntax=”ECMAScript” stopProcessing=”true”>
<match url=”^app.js\/debug[\/]?” />
</rule>
At the bottom of web.config modify this line (or line similar to this):
<iisnode watchedFiles=”sentinel;web.config;iisnode.yml;*.js;tables\*.*;api\*.*”/>
And add the highlighted section below:
<iisnode debuggerExtensionDll=”iisnode-inspector.dll” watchedFiles=”sentinel;web.config;iisnode.yml;*.js;tables\*.*;api\*.*”/>
If the iisnode entry does not exist then set it to this:
<iisnode debuggerExtensionDll=”iisnode-inspector.dll” />
Sample from Azure Mobile App:

and save the changes!
Open your WebKit enabled browser (in my example I am using Chrome) and hit this URI (substitute the URL of your Azure Mobile App though):
http://jsandersdebugnodejs.azurewebsites.net/app.js/debug
TWO IMPORTANT NOTES:
1. Use HTTP not HTTPS (Authentication requires HTTPS so you cannot debug the site if Authentication is required)
2. User your Web App or Mobile App name:
http://yourapp.azurewebsites.net/app.js/debug
Now you have Node Inspector at your disposal!

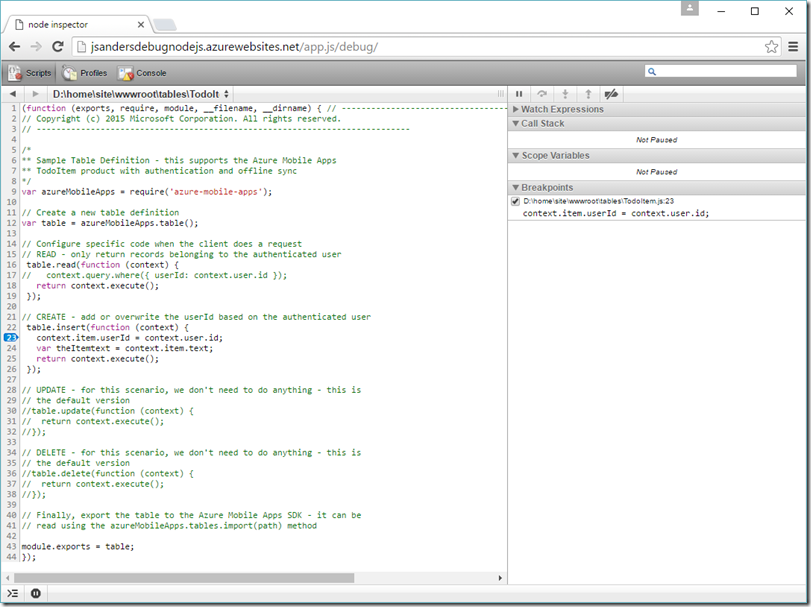
I want to debug that script I saw that had a problem when I was debugging in Monaco. To do that choose the ‘Scripts’ icon then use the up-down arrow icon I have highlighted to find the table script I want (tables\TodoItem.js):
Note: If scripts do not show anything, warm up the Mobile App site by hitting it in another browser tab, then refresh the debug session.

Now click on the number ‘23’ on the left side to set a breakpoint in the insert statement:
And use a tool like Fiddler or Postman (or your app) to call the App:

You will have hit the breakpoint where you can inspect stuff and see what the problem is!
In my case I look at the ‘Scope Variables’ section and there is no ‘user’ property on the ‘context’ object and that is why it is faulting in my app:

Also note above I can see the ‘context.item’ object that has the information I am trying to insert. Pretty darn awesome or what?!?!
Final Important notes
Special thanks to Prashanth Madi on our team for help with this Blog!
Use this with caution. Do not debug a live site because when you are in the debugger, you are stopping the scripts you are setting breakpoints for until you hit the ‘resume’ button (little triangle icon above the ‘Watch Expression’
Restore back the changes you made after debugging
Search for Node Inspector for cool tips using Node Inspector
This works for Azure Web Apps and Azure Mobile Apps.
You can use Monaco to edit iisnode.yml and web.config if you wish.
Send me a comment if this helped you out!
Helpful links: