This post has been republished via RSS; it originally appeared at: Azure Database Support Blog articles.
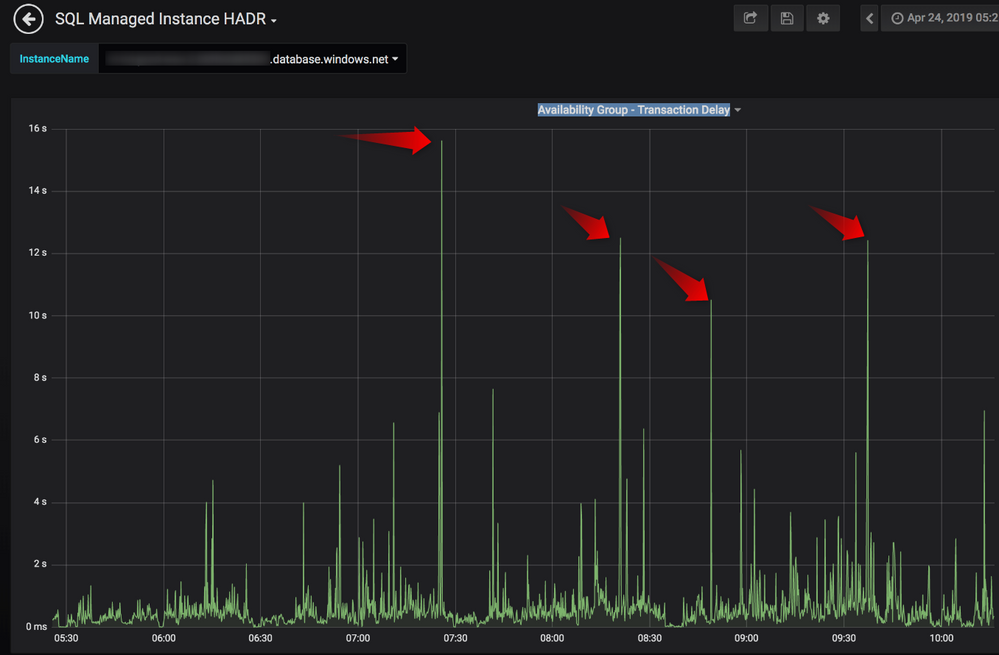
I got a recent case where a customer was worried with high transaction delays on an Azure SQL DB around 15sec and that would be really bad
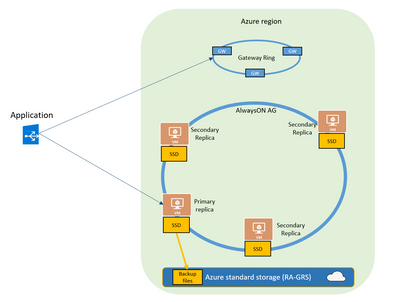
When using premium DBs, Azure SQL DB will use AlwaysOn behind the scene to provide you HA
Customer identified this transaction delays using a tool called TELEGRAF. This tools was already commented by the SQLCAT team.
In the image below we can see those peaks:
Considering customer was seeing transaction delay I went to SQL waits to check exactly what was SQL waiting for. The wait HADR_SYNC_COMMIT is responsible to track transaction delays
However looking in the server waits I could NOT see it as a TOP wait and that was not looking right
We suspected that was an issue with the tool, and as this is a open source I was able to search it to identify what exactly the tool was measuring (https://github.com/influxdata/telegraf/blob/adc32002da4a7dcbcf9b0ac15f34922b10372fdc/plugins/inputs/sqlserver/sqlserver.go ) and it was looking on sys.dm_os_performance_counters, counter "Transaction Delay"
This was documented on our docs as "Transaction Delay - Delay in waiting for unterminated commit acknowledgement, in milliseconds.". The main problem was not the counter but is the understand of what is exactly is measured by this counter.
The solution to this problem is that you need to divide (Transaction Delay) / (Mirrored Write Transactions/sec) to get AVG DELAY. This means customer had 15 seg of wait for ALL transactions on that measured second
More information below
Running in synchronous availability mode, the best way to find out what the delay introduced is, is to check two performance counters on the primary replica:
SQL Server:Database Replica –> Transaction Delay
SQL Server:Database Replica –> Mirrored Write Transactions/sec
The first value is an accumulation of the delay of all the current transaction delay in millisecond
The second counter is the value of transactions which indeed caused data transfer with AlwaysOn (in opposite to SQL Server:Database – Transactions/sec which does include pure read transactions as well).
In order to get to the average transaction (in principle commit delay) one only has to divide both values. In the screen shot below we look at an average Transaction Delay of 392 milliseconds (green line in 0.1 scale) and around 60 Write Transactions/sec (red line in scale 1.0). Calculating the numbers, we look at a transaction delay of around 6.5ms.
After found the information below I requested an update to official doc to avoid future confusion


