
This post has been republished via RSS; it originally appeared at: Failover Clustering articles.
Overview
Do you have a large number of virtualized workloads in your cluster? Have you been looking for a solution that allows you to detect if any of the virtualized workloads in your cluster are behaving abnormally? Would you like the cluster service to take recovery actions when these workloads are in an unhealthy state? In Windows Server 2012, there is a great new feature, in Failover Clustering called “VM Monitoring”, which does exactly that – it allows you monitor the health state of applications that are running within a virtual machine and then reports that to the host level so that it can take recovery actions. You can monitor any Windows service (such as SQL or IIS) in your virtual machine or ANY ETW event occurring in your virtual machine. When the condition you are monitoring gets triggered, the Cluster Service logs an event in the error channel on the host and takes recovery actions.
In this blog, I will provide a step by step guide of how you can configure VM Monitoring using the Failover Cluster Manager in Windows Server 2012 or later.
Note: There are multiple ways to configure VM Monitoring. In this blog, I will cover the most common method. In a future blog, I will cover the many different flexible options for configuring VM Monitoring.
Configuring VM Monitoring
Pre-requisites
Before you can configure monitoring from the Failover Cluster Manager on a Management Console the following pre-steps are required:
- Configure the guest operating system running inside the virtual machine
- The guest operating system running inside the virtual machine must be running Windows Server 2012 or later
- Ensure that the guest OS is a member of a domain which is same as the host or a domain with a trust relationship with the host domain.
-
Grant the cluster administrator permissions to manage the guest
-
The administrator running Failover Cluster Manager must be a member of the local administrators group in the guest
-
-
Enable the “Virtual Machine Monitoring” firewall rule on the guest
-
Open the Windows Firewall console
-
Select “Allow an app or feature through Windows Firewall”
-
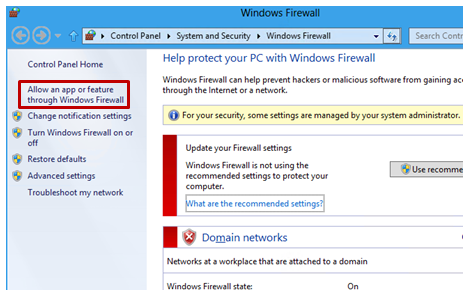
c) Click on “ change settings ” and enable the “ Virtual Machine Monitoring ” rule.
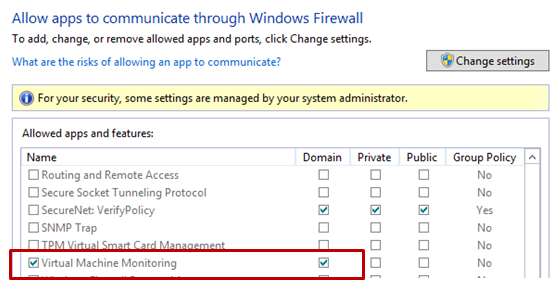
Note: You can also enable the “Virtual Machine Monitoring” firewall rule using the Windows PowerShell® cmdlet Set-NetFirewallRule :
Set-NetFirewallRule -DisplayGroup "Virtual Machine Monitoring" -Enabled True
Configuration
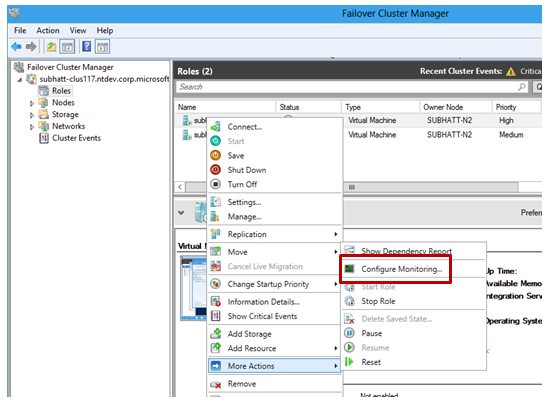
VM Monitoring can be easily configured using the Failover Cluster Manager through the following steps:
- Right click on the Virtual Machine role on which you want to configure monitoring
- Select “ More Actions ” and then the “ Configure Monitoring ” options
3) You will then see a list of services that can be configured for monitoring using the Failover Cluster Manager. 
Note:
You will only see services listed that run on their own process e.g. SQL, Exchange. The IIS and Print Spooler services are exempt from this rule. You can however setup monitoring for any NT service using Windows PowerShell® using the Add-ClusterVMMonitoredItem cmdlet – with no restrictions:
Add-ClusterVMMonitoredItem –VirtualMachine TestVM -Service spooler
How does VM Monitoring work?
When a monitored service encounters an unexpected failure, the sequence of recovery actions is determined by the Recovery actions on failure for the service. These recovery actions can be viewed and configured using Service Control Manager inside the guest. In the example below, on the first and second service failures, the service control manager will restart the service. On the third failure, the service control manager will take no action and defer recovery actions to the cluster service running in the host. 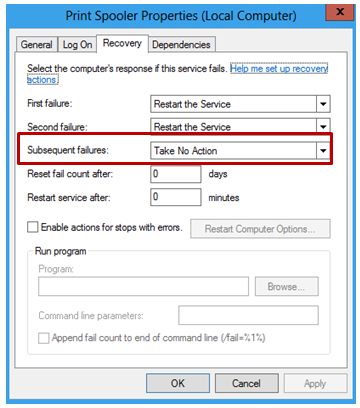
The cluster service monitors the status of clustered virtual machines through periodic health checks. When the cluster services determines that a virtual machine is in a “critical” state i.e. an application or service inside the virtual machine is in an unhealthy state, the cluster service takes the following recovery actions:
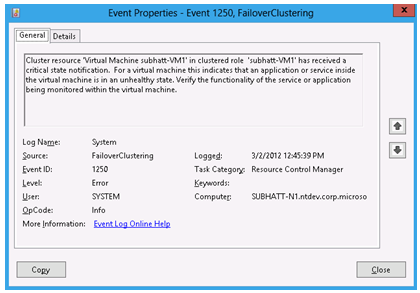
1) Event ID 1250 is logged on the host
a. This event can be monitored with tools such as System Center Operations Manager to trigger further customized actions
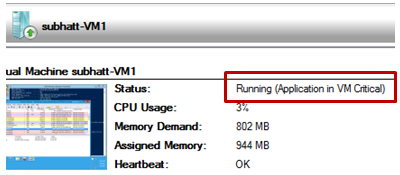
2) The virtual machine status in Failover Cluster Manager will indicate that the virtual machine is in an “Application Critical” state.
Note:
- Verbose information is logged to the Cluster debug log for post-mortem analysis of failures.
- The StatusInformation resource common property for a virtual machine in “Application Critical” state has the value 2 as compared to a value of 0 during normal operation. The Windows PowerShell® cmdlet Get-ClusterResource can be used to query this property.
Get-ClusterResource “TestVM” | fl StatusInformation
3) Recovery action is taken on the virtual machine in “Application Critical” state
a. The virtual machine is first restarted on the same node
Note: The restart of the virtual machine is forced but graceful
b. On the second failure, the virtual machine restarted and failed over to another node in the cluster.
Note: The decision on whether to failover or restart on the same node is configurable and determined by the failover properties for the virtual machine.
That’s the VM Monitoring feature in a nutshell!
Subhasish Bhattacharya
Senior Program Manager
Clustering & High Availability
Microsoft