This post has been republished via RSS; it originally appeared at: ITOps Talk Blog articles.
The way human brain processes information, using something such as chart, makes it easier to visualize large amounts of data rather during to understand it through a PowerShell output or excel spreadsheet. Seeing your Azure resources visually can help you make better decisions on how to manage your environment, identify risks and areas of improvement. Combine the power of Azure Resource Graph Explorer with an Azure dashboard and now you have a focused and organized view of your environment, such as an Inventory Dashboard. The power of Azure Resource Graph is more than just advanced powerful queries to gain insight into your environment. It's that you can now take those results to become visual data by creating charts and graphs.
How do we do this ?
Using Azure Resource Graph Explorer you can query your Azure environment and display the results of the query into a chart to be displayed in your dashboard. You can also build custom dashboards with all your queries that can shared to other team members.
First let's show you how to run a query and display on your dashboard the later we'll show how to build custom dashboard.
Steps to create a Query in Azure Resource Graph Explorer and pin to your dashboard:
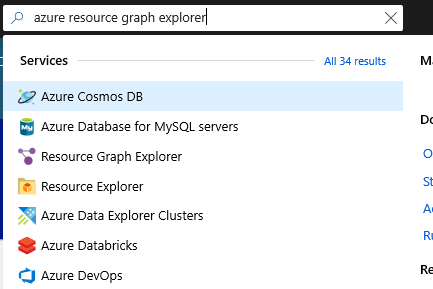
1. First open Azure Resource Graph Explorer in the Azur Portal.
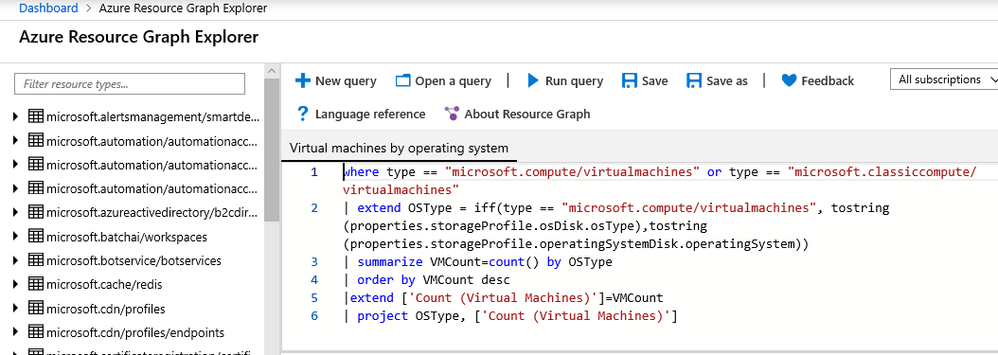
2. Create your query. For this example we want to see summary of all VMs by OS type. To see a list of starter queries check them out here. Once you have your query, hit the Run Query.
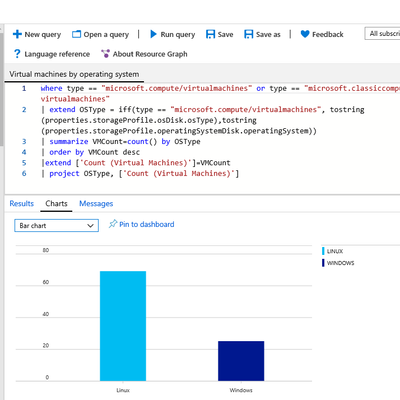
3. When the results are completed you can select to see the results as bar or pie chart.
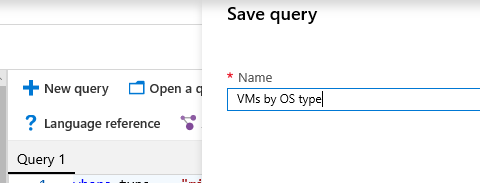
4. On the top bar, select Save As to save your query
5. When that is completed you can select to pin the query to your dashboard
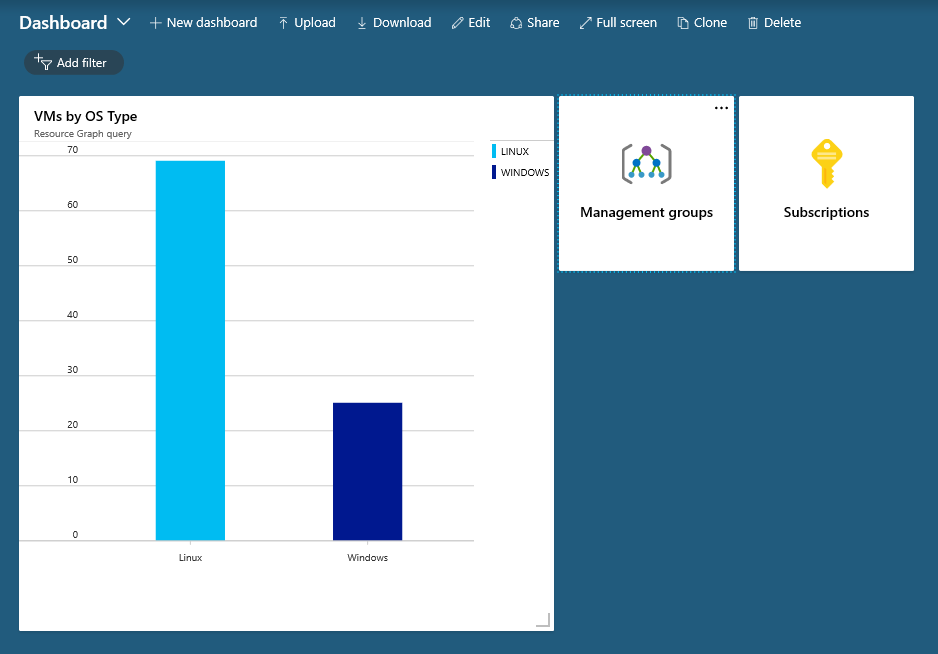
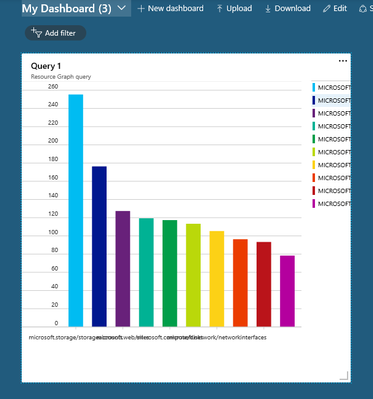
6. Now when you go to your dashboard you will see you're saved query.
Building a Customized Dashboard
If you want to create an inventory dashboard of your environment you do the same steps as with different queries that can be found here and pin the results to an a blank dashboard or an existing one. You can also add Azure Resource Graph explorer tiles to a dashboard and customized the data in that tile. The following will be an example of creating a brand new dashboard and also using a preselected Azure Resource Graph Tile.
Create a new dashboard
- Sign in to the Azure portal.
- Select Dashboard from the upper section of the left sidebar. Your default view might already be set to dashboard.
- Select + New dashboard.
Adding a Azure Resource Graph tile to a Dashboard
1. Select Edit from the page header.
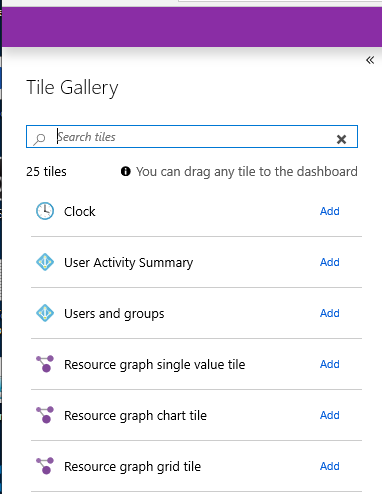
2. Browse the Tile Gallery and select Azure Resource Graph Explorer.
3. Select Add to automatically add the tile to the dashboard with a default size and location. Or, drag the tile to the grid and place it where you want. Continue to add as many tiles as you would like on your dashboard and then select done customizing.
Customizing the data on your Azure Resource Graph
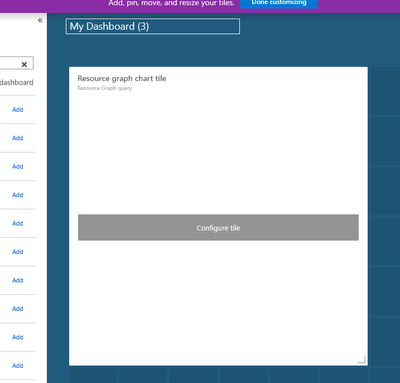
1. In the tile Select Configure tile
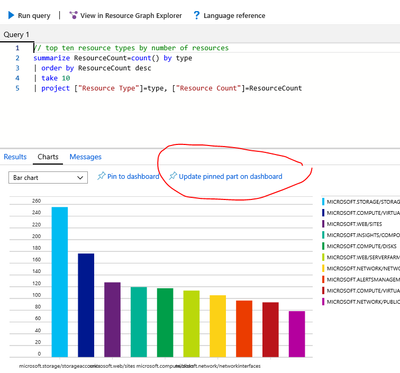
2. Select the Update Pinned part on dashboard
3. Once the data has been updated it will now display the results in your dashboard.
Tips to consider
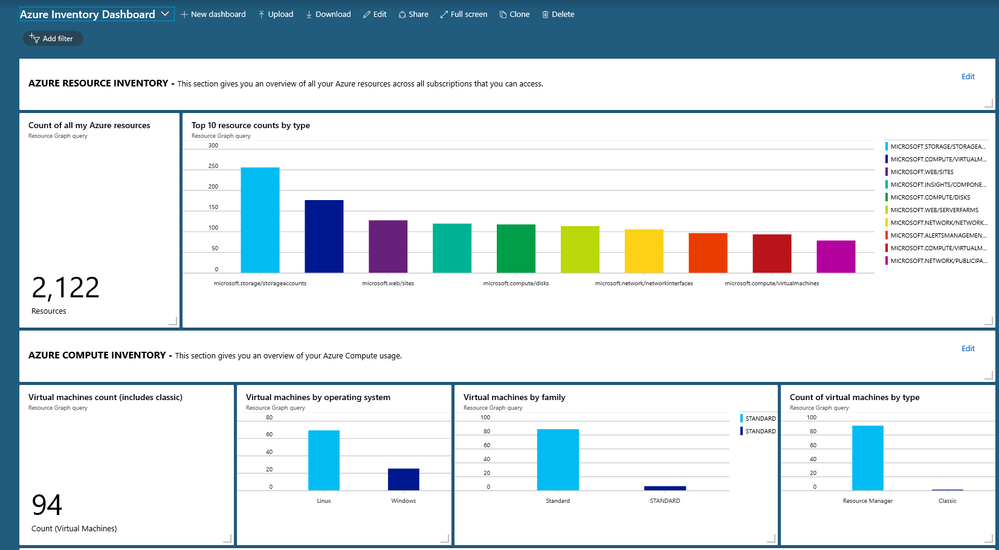
You will also notice that once the data is update with your environment data the name of the query uses the default Query name. If you want a custom tile name for each query you may find that it is easier to use a blank dashboard and run a bunch queries from Azure Resource Graph Explorer then save them with the name that you prefer. Your final result can look like below example.

