This post has been republished via RSS; it originally appeared at: New blog articles in Microsoft Tech Community.
This post is in two parts.
1. Workbook import instructions
2. The finished workbook
I have created the workbook for you, so you just need to import it, using these instructions:
1. Workbook Import Instructions.
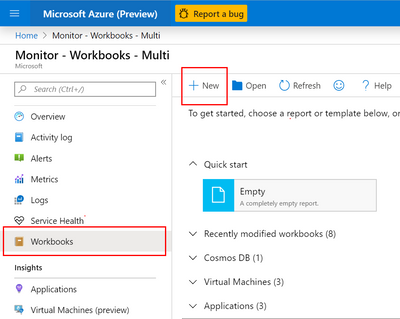
Create a NEW workbook
Enter into the Advanced Editor by pressing this button.
Note: Please delete the current info between the { and }.
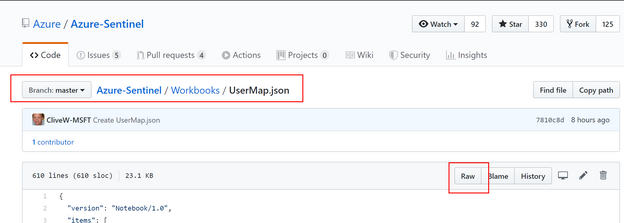
You can find the related Workbook in the Sentinel GitHub, it’s called “UserMap.json”:
https://github.com/Azure/Azure-Sentinel/tree/master/Workbooks
Use the RAW button, then select all the text (CTRL-A), then copy (CTRL-C) and paste into the Advanced Editor pane.
The press Apply and remember to SAVE it (if you like it).
2. The finished Workbook
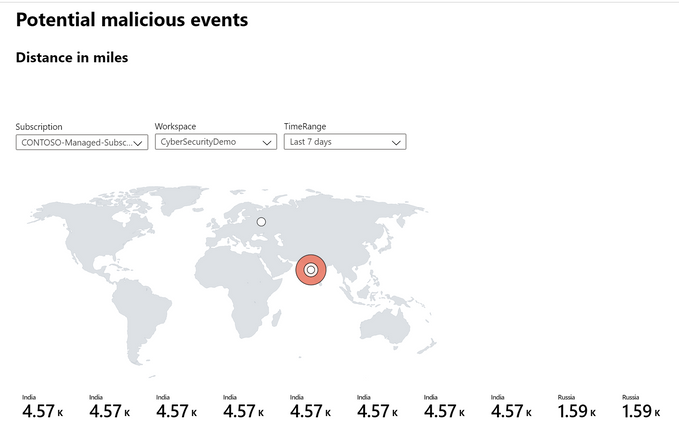
You should now see the same World Map as per my last post. https://techcommunity.microsoft.com/t5/Azure-Sentinel/How-to-use-Azure-Monitor-Workbooks-to-map-Sentinel-data/ba-p/971818
The KQL explained
This query relies on you having data in the Azure SigninLogs table. https://docs.microsoft.com/en-us/azure/sentinel/connect-azure-active-directory
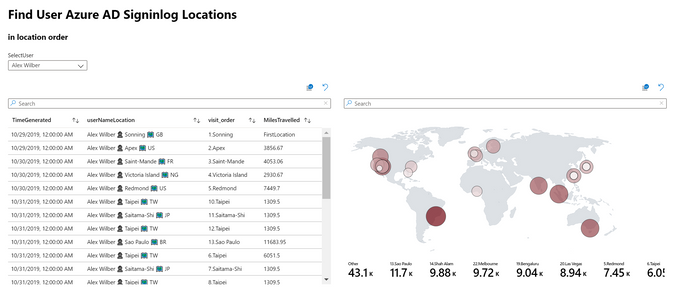
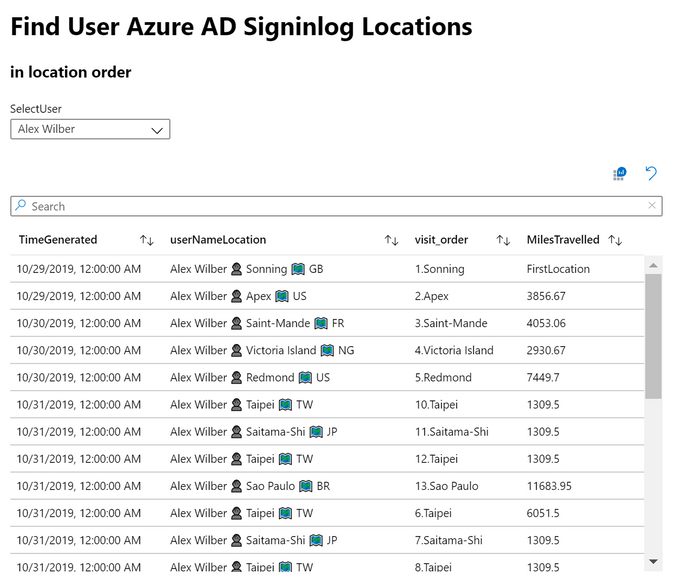
Now we can also track people (assuming you have longitude and latitude info in the table). I have added an extra drop down dialog box so you can select your user from a list. We then use that users name to find where they logon .
Note: SigninLogs
location info is affected by your network, so you may see some inaccuracies depending on VPNs etc…
On the right I also mapped the locations again (as per the last blog post).
The Query used for the table on the left is (see query below, it is the example actually used in the workbook so wont work in Log Analytics ‘as is’ find a Log Analytics compatible version us this link (it wont run as our demo tenant doesn't have the required Table)
Go to Log Analytics and see the Query
Query Summary:
This query, grabs a few bits of data early on, like the Longitude and Latitude, City and State etc..
I then make use of the Prev() function to get the PREVious latitude and longitude (for the first location, that gets called “FirstLocation” as it doesn't have previous data.
We then use geo_distance_2points again to compare the users last location to the current and calculate that in miles (replace with KM if you prefer). I also remove any logons for the same location (this maybe useful to see – just comment out the line, starting with: where distance_in_miles !="0.0"
I finish by summarizing the data, and using a strcat to merge some columns (also taking the opportunity to add some Icons/Emojis).
KQL that works in my Azure Monitor Workbook
You should now be able to select a User then see their travel information / miles moved.
This is the same view (see below table) but run in Log Analytics. Please take a look the data (if you have it) and this is just one example of how you can use it.

