This post has been republished via RSS; it originally appeared at: New blog articles in Microsoft Tech Community.
Azure Data Explorer supports running Python code embedded in Kusto query language using the python() plugin. The plugin runtime is hosted in a sandbox, an isolated and secure Python environment. The python() plugin capability extends KQL (Kusto Query Language) native functionalities with the huge archive of OSS Python packages. This extension enables you to run advanced algorithms, such as ML, AI, statistical, and Time Series Analysis as part of the query.
KQL tools aren't convenient for developing and debugging Python algorithms. Therefore, the best practice is to develop the algorithm on your favorite Python IDE such as Jupyter, PyCharm, VS, or VS Code. When the algorithm is complete, copy and paste the python code into KQL. To improve and streamline this workflow, Azure Data Explorer supports integration between Kusto Explorer or Web UI clients and VS Code for authoring and debugging KQL inline Python code.
Query example
- Run the KQL query in Kusto Explorer, prefix it with the set query_python_debug; statement:
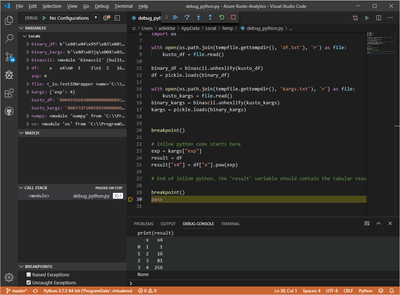
- VS Code is launched. You can debug your script, for example, to verify the table that is returned to ADX you can breakpoint at the end of the script and from the debug console print the ‘result’ dataframe:
For further information see the full documentation

