This post has been republished via RSS; it originally appeared at: New blog articles in Microsoft Tech Community.
In case you missed our first blog where we talk about creating custom reports using Microsoft Defender ATP APIs and Power BI, check it out here.
Gathering feedback and requirements helps us improve our threat protection stack and better serve the needs of our customers. Often, I’ll ask about customer use cases and their specifics so that we can align our engineering resources to help streamline customer processes.
A common use case I frequently get asked about is how to get a simple view on IP configuration, IP lease, or DNS configuration for a device. Security teams often need to map these entities against an endpoint because there might be suspicious events happening in the firewall or proxy logs.
To provide visibility into these events, we’ll leverage the flexibility that Power BI provides to create reports using the rich and complete set of APIs available in Microsoft Defender ATP. You can even integrate third-party data sources to further enhance the data set.
For more information, see Why Power BI.
In this blog, we’ll tackle two problems typical enterprises face:
- IP addresses, network configs, etc are changing fast because people are on the move, working remotely, or DHCP lease validity temporary. Therefore, investigating and connecting all relevant dots and points of information can be challenging.
- Different departments and responsibilities slow down the investigation process and you will end up with problem #1 again.
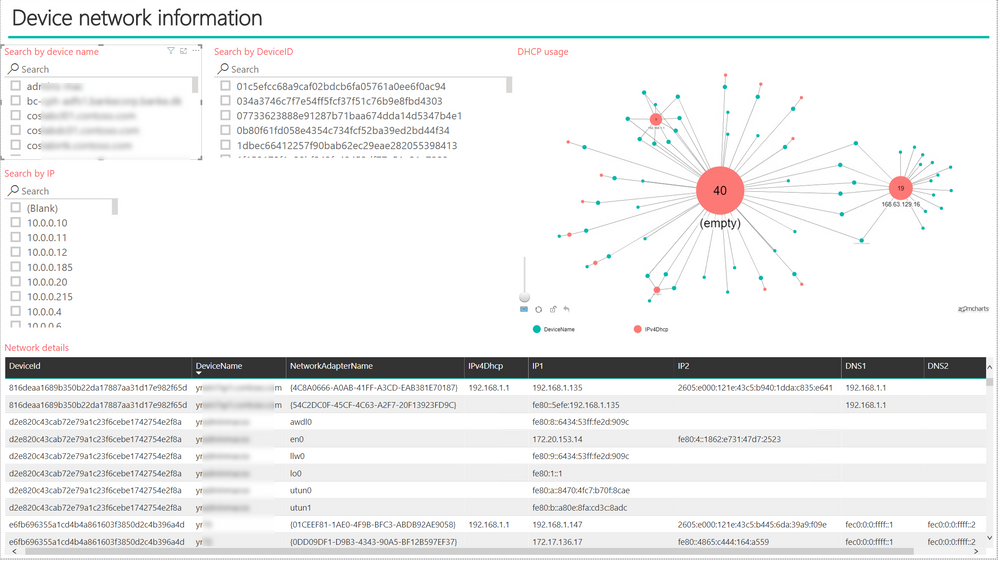
We will be using the DeviceNetworkInfo entity within Advanced hunting as a data source to create a networking report. This entity contains all the relevant information you need to get a good understanding on the actual networking configuration of a device reporting into Microsoft Defender ATP.
DeviceNetworkInfo within advanced hunting.
This data is also available on the advanced hunting APIs – more details about advanced hunting APIs can be found here
To create the dashboard below we’re using two different queries in Power BI:
Query = "DeviceNetworkInfo | extend ipAddressesJson = parse_json(IPAddresses) | project DeviceName, DeviceId ,IPv4Dhcp, DefaultGateways, NetworkAdapterName,Timestamp,IP1 = ipAddressesJson[0].IPAddress, IP2 = ipAddressesJson[1].IPAddress, IP3 = ipAddressesJson[2].IPAddress, IP4 = ipAddressesJson[3].IPAddress, IP5 = ipAddressesJson[4].IPAddress | summarize arg_max(Timestamp, DeviceName, IPv4Dhcp,DefaultGateways, IP1, IP2, IP3, IP4, IP5) by DeviceId , NetworkAdapterName",
And
Query = "DeviceNetworkInfo | extend dnsJson = parse_json(DnsAddresses) | project DNS1 = dnsJson[0], DNS2 = dnsJson[1], DeviceId , Timestamp | summarize arg_max(Timestamp, DNS1, DNS2) by DeviceId",
After connecting the relevant tables, you can start and create your own dashboard or just simply build on top of this example.
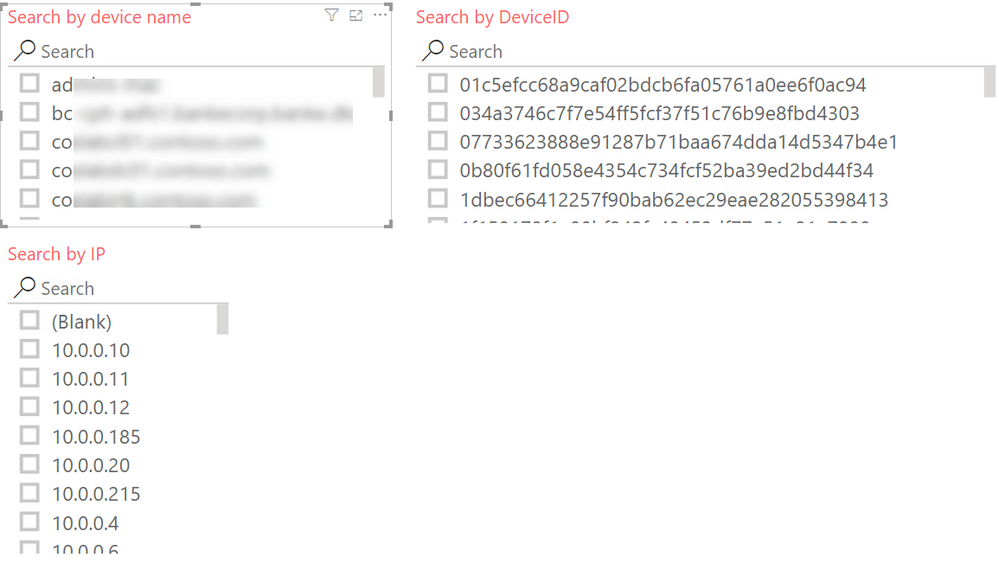
We integrated multiple slicers to provide search functionalities to easily search for items like IP, DNS, or DHCP addresses.
Conclusion
As you can see, there are several data entities in Microsoft Defender ATP which can be used to create custom reports – the more challenging task is to identify your use cases / scenarios where custom reporting can provide additional visibility and help to streamline processes.
All the content shared within this blog series will go into our newly created GitHub repository for reporting.
You´ll find the report from this blog here.


