This post has been republished via RSS; it originally appeared at: New blog articles in Microsoft Tech Community.
Azure Resource Tags are a powerful tool to help organize your Azure Resources. You may have seen Microsoft's Thomas Mauer recent post on resource tagging, or fellow MVP Tao Yang's post on using Azure Policy to apply tags. Those are nice posts on why and how to implement and use Tags. This post will detail the built-in value from a monitoring perspective once you're tagging your resources.
I'm going to show how to build this in Azure Monitor Workbooks. If you're not familiar with Workbooks, I have a intro and deep dive video here. In Workbooks we can query Azure Resource Graph and surface logs from Log Analytics and Application Insights, as well as Azure Resource Metrics. We can also query Azure Resource Graph and Log Analytics to create parameters we can use later. We can query other Azure Resources but for the purposes of this post those are what I'll be using in the workbook.
Resource Graph
At 3Cloud we tag all resources upon deployment. We do several tags from who created the resource, to creation date and resource location. Two tags in particular that are useful for monitoring scenarios: Application and Environment. To use these tags we'll use Azure Resource Graph. In Azure Resource Graph we can query a tags to see what's in our environment.
[code language="sql"]
resources | distinct tostring(tags)[/code]
This will capture all tags. Because tags are a dynamic type in Resource Graph we need to use tostring() to bring back the information.
To get all resources tagged with "Application" we can do the following.
[code language="sql"]

resources | distinct tostring(tags.Application)[/code]
In my case I'll be demoing the Tailwind Traders app so I know my tag name already.
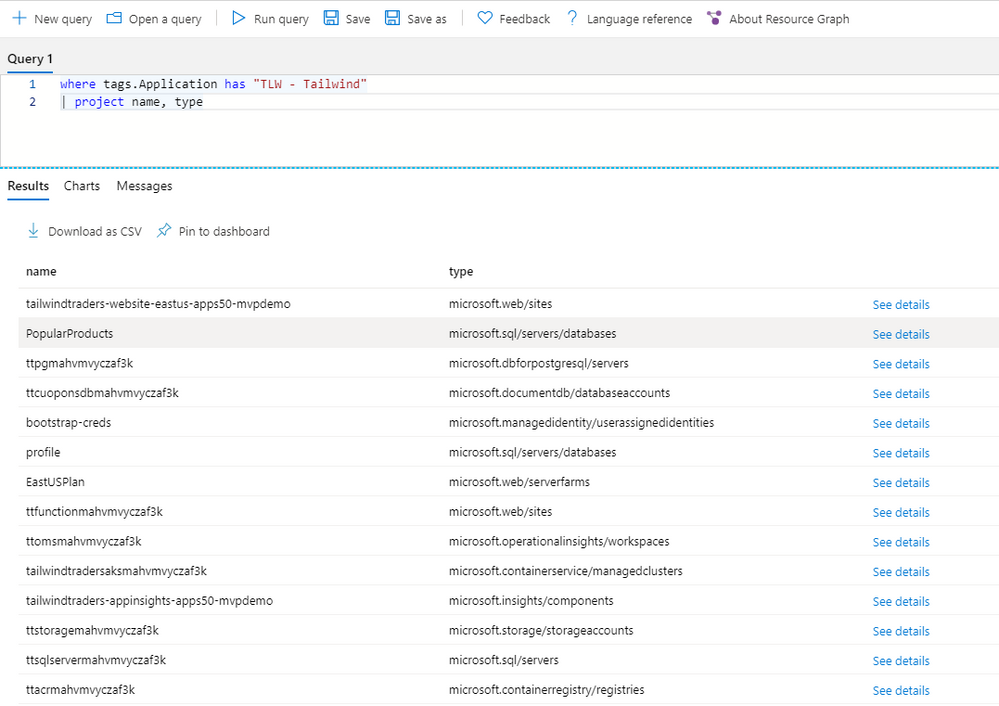
[code language="sql"]where tags.Application has "TLW - Tailwind" | project name, type[/code]
You can see we have a number of resources for our app. Using 'has' or 'contains' will also allow us to query resources that may be shared across applications like a Web Application Firewall or SQL Managed Instance, by adding multiple Application tag names to the same resources.
Workbook
Opening up a blank Workbook, Azure Monitor -> Workbooks -> Empty. We'll start with Parameters.
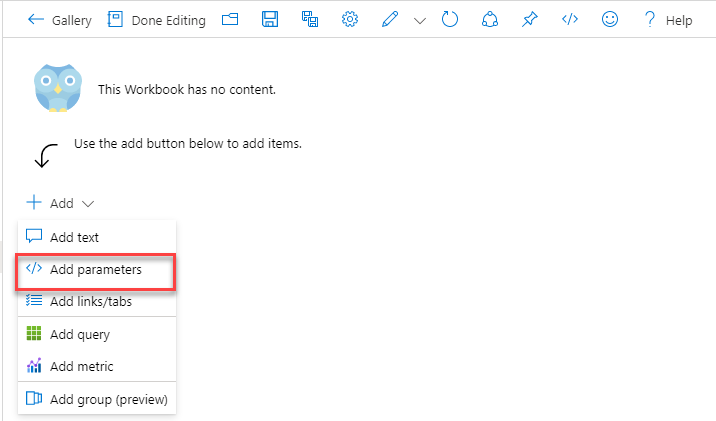
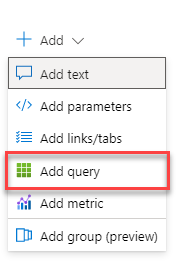
Click on Add and select Add parameters
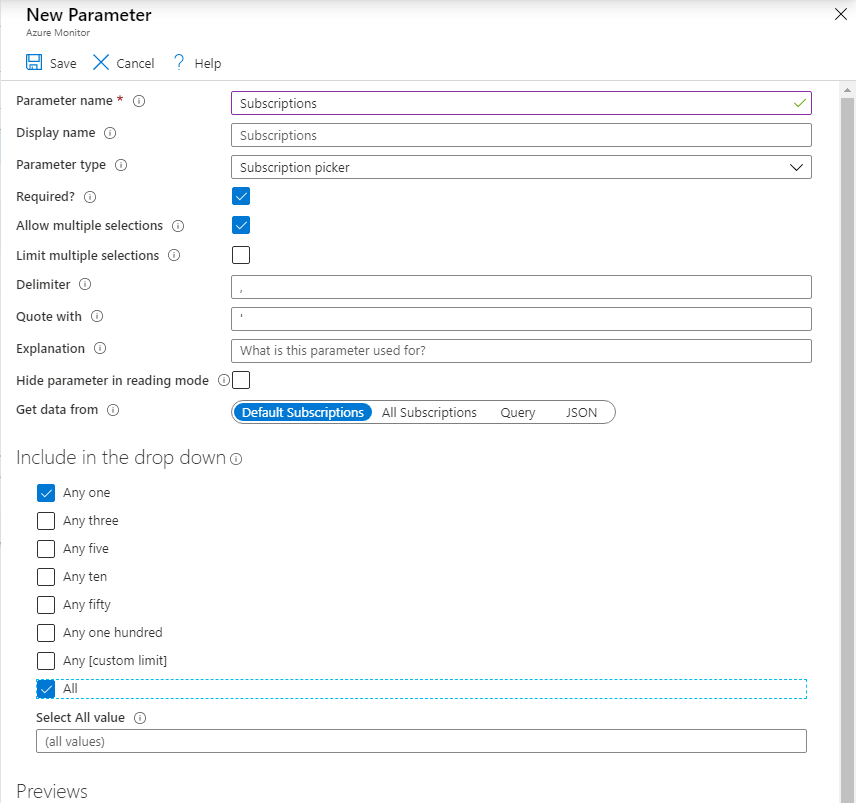
First we'll create a subscription parameter. Typically we'll deploy a Prod and Non prod subscriptions, so this will allow us to easily switch between prod and non prod resources in the workbook.
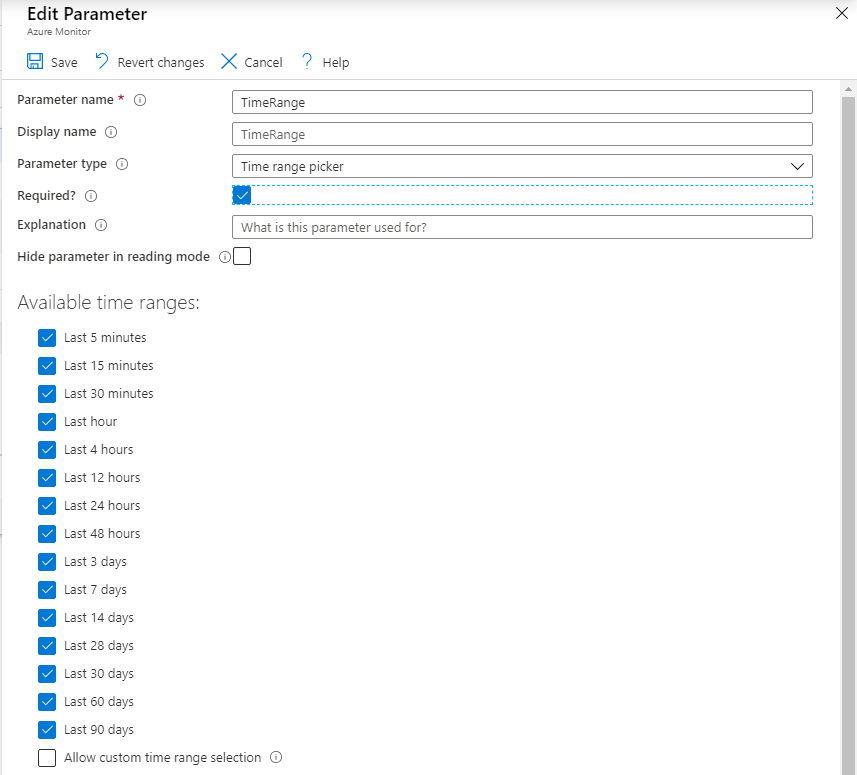
Next we'll add a TimeRange parameter.
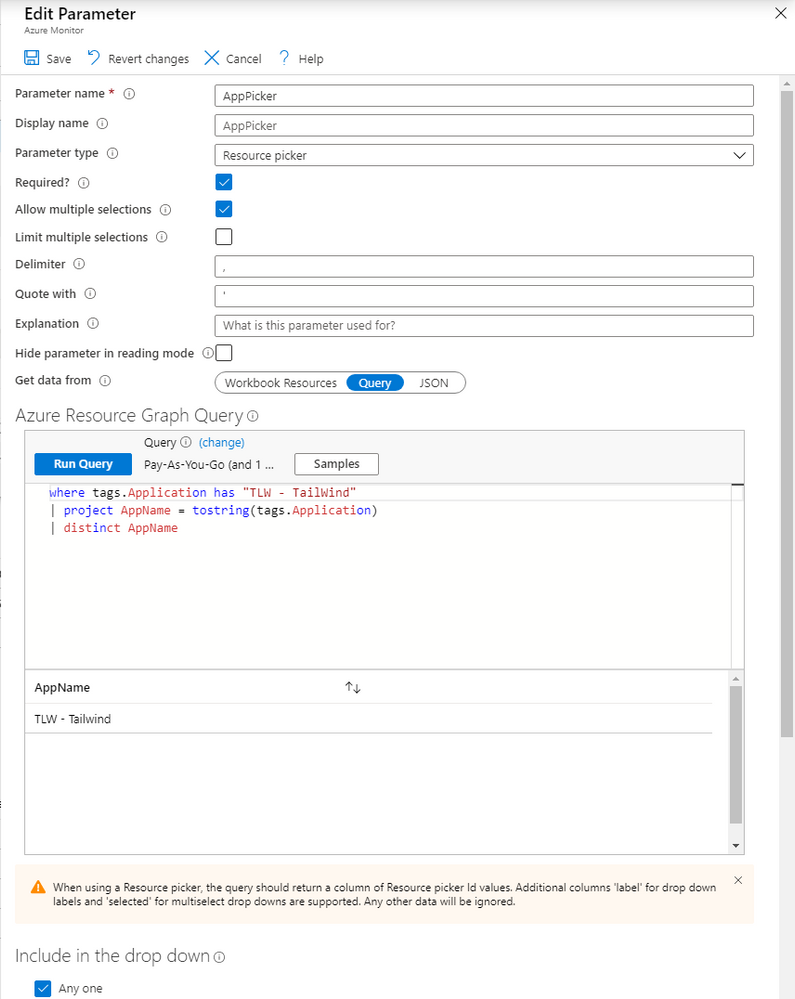
Now, we'll add a parameter called AppPicker. If you have several applications that are built the same way you can include them here with Or statements. In this case I'm just using the one Tailwind app.
[code language="sql"]
where tags.Application has "TLW - TailWind"
| project AppName = tostring(tags.Application)
| distinct AppName[/code]
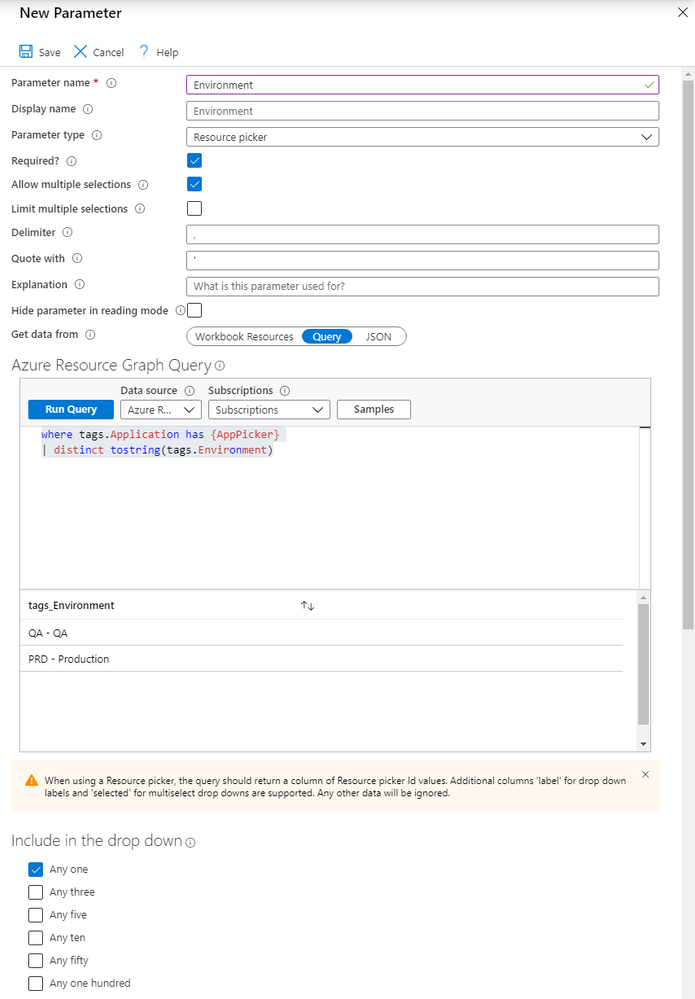
Next, we'll add Environment parameter. This will dynamically pick up all environment types you've used in Tags and allow us to apply it to our Application Resources.
[code language="sql"]
where tags.Application has {AppPicker}
| distinct tostring(tags.Environment)[/code]
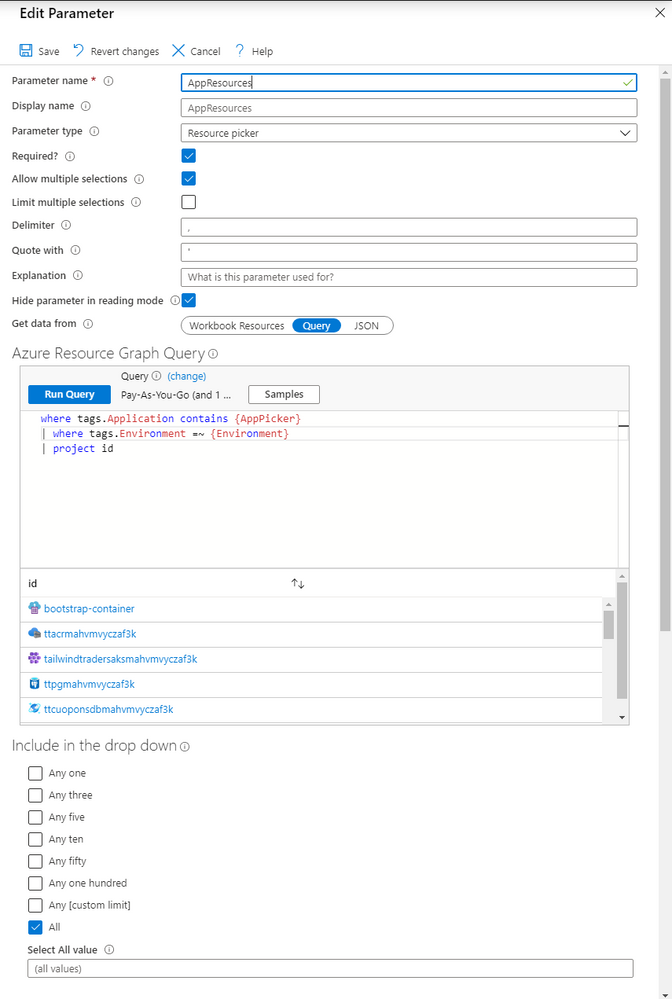
Finally, we have AppResources. This uses the Subscription parameter for the query, the AppPicker Parameter and the Environment parameter in the actual Azure Resource Graph query. Note that Subscription, AppPicker and Environment need to be set in the workbook before you try to run this query. We'll also make this one required, hidden, and select only All. Because this is the parameter that controls everything we want all the resources for our application in this one parameter. Also the reason I am projecting the ID, is in Workbooks using the resource ID will automatically bring in the nice Azure icon, and clicking on that resource will automatically take you directly to that resource in the portal.
[code language="sql"]
where tags.Application contains {AppPicker}
| where tags.Environment =~ {Environment}
| project id[/code]
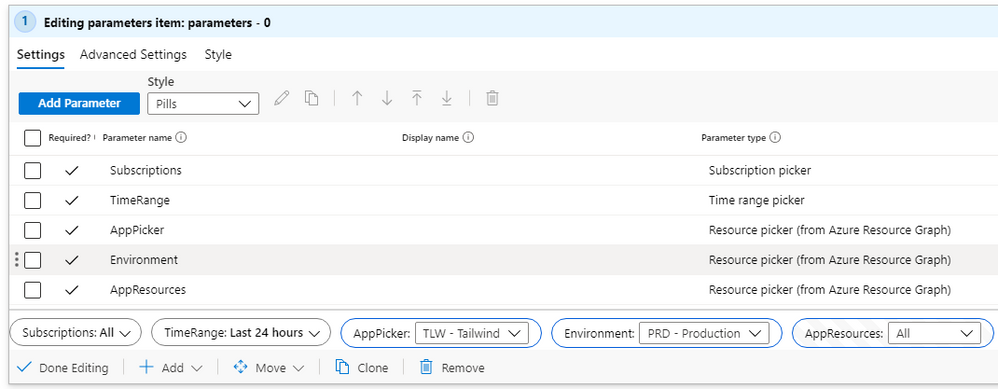
Now you should have parameters like below.
Metrics
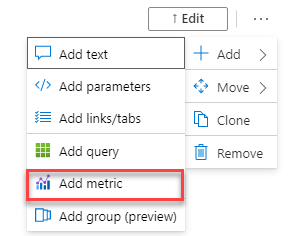
Next add a Metric widget.
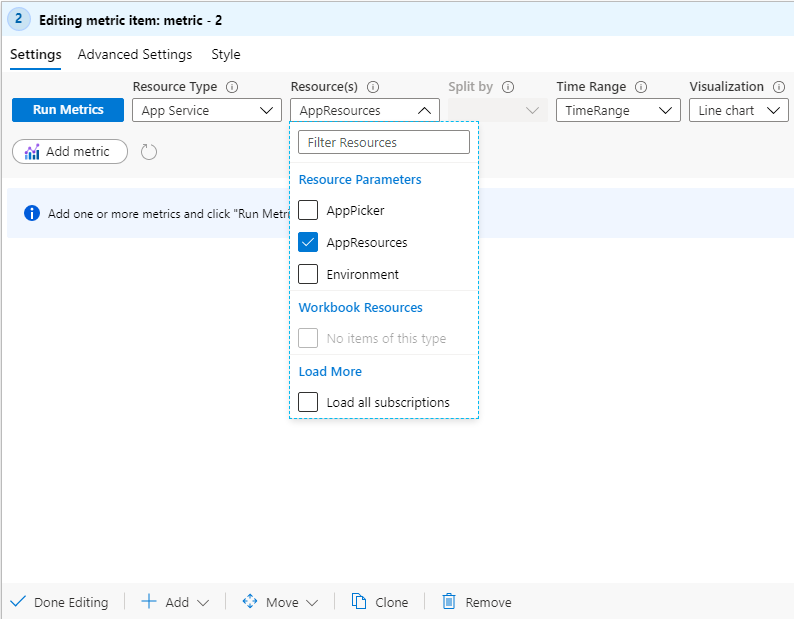
In my case because Tailwind Traders uses Application Services we'll set that as our Resource Type. Then for Resources we'll select our AppResources Parameter.
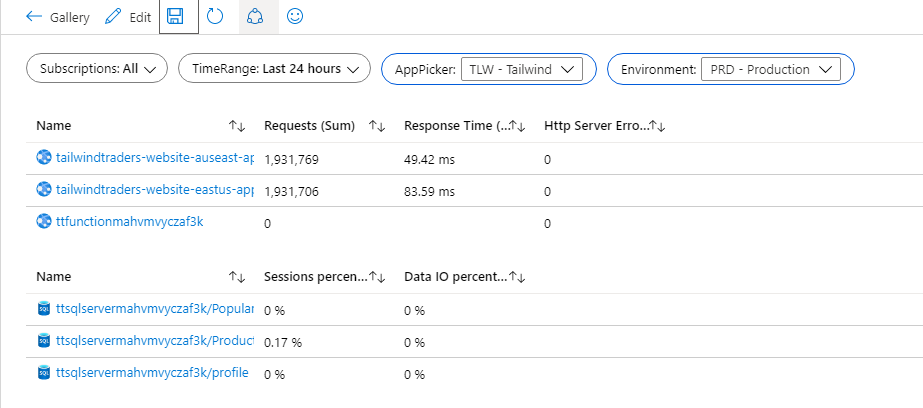
Add your metrics, in my case I picked Requests and Response time. Then added another Metric widget and selected SQL as my Resource Type.
The workbook is smart enough to only grab the resources in AppResources parameter that match the Resource Type we've selected. This will work across all resources that support tagging and are putting out Metrics to Azure Monitor. Any new resources that gets added to your application, like adding additional App Services or SQL Databases, provided they are tagged will automatically show up in our workbook.
Logs
But what about logs? We can use the same methods to dynamically query our resources in both Log Analytics and Application Insights.
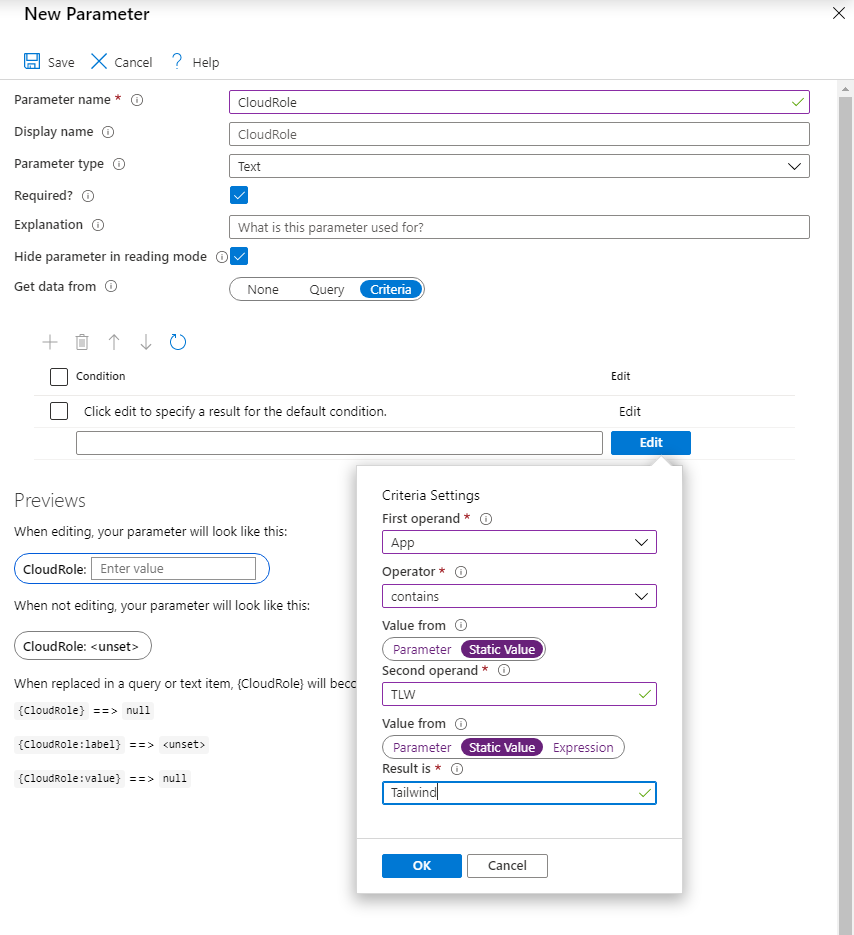
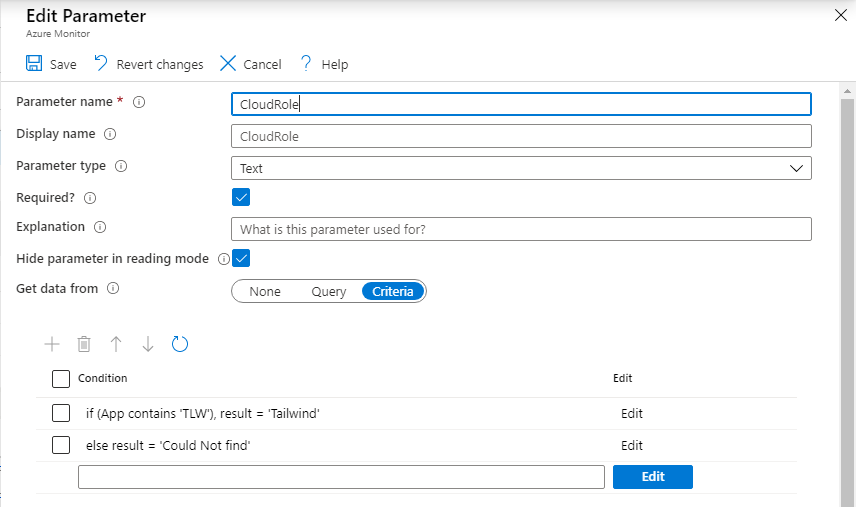
Going back up to our Parameters, we'll add a new one called CloudRole. We'll set it to a Criteria. The first operand will be AppPicker, we'll put in TLW for our second operand. Our operator is contains. Our result will be 'Tailwind'
You'll also need to add an else result, as I've done here.
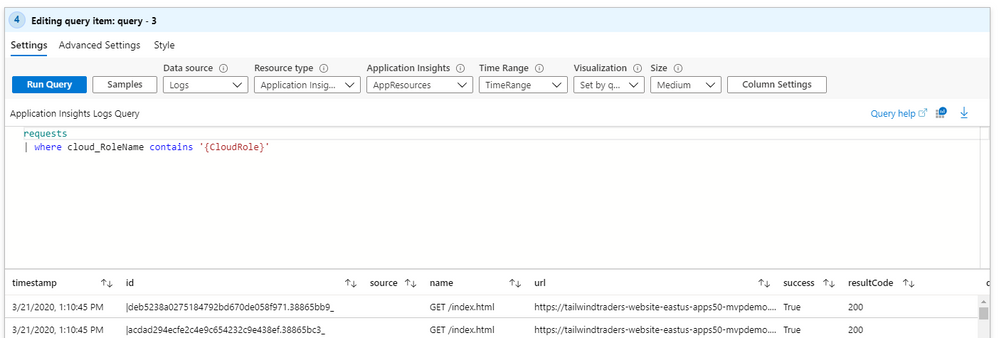
Next add a query to the workbook.
We'll set it to Logs, Resource Type is Application Insights and we'll set the workspace with AppResources parameter. Using '{CloudRole}' in our query will return us logs only from the Tailwind cloud role instance in Application Insights. This is more relevant if you are querying across multiple App Insights workspaces or if you are sending multiple applications data to a single workspace.
[code language="sql"] requests | where cloud_RoleName contains '{CloudRole}'[/code]
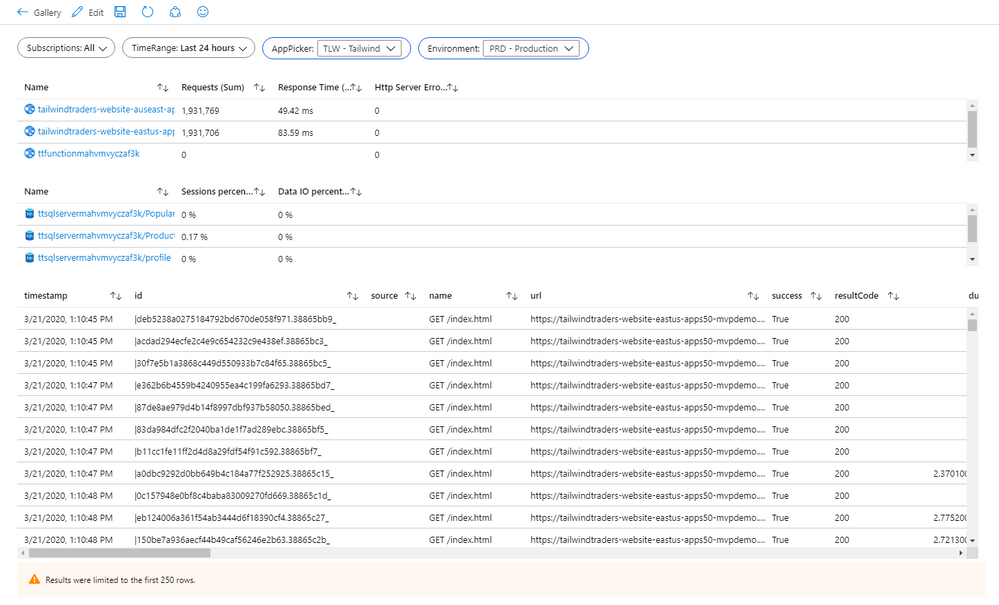
The overall workbook will look like this. From here you can add more metrics, as well as metrics for the rest of your resources, adding heatmaps or line graphs on the metric charts and cleaning up the log for only relevant fields. Adding Log Analytics for our diagnostic logs. This one workbook can be used to monitor all resources in our application across dev, QA and Prod.
Conclusion
Using Azure Resource Graph, Tags and Azure Monitor Workbooks we can build dynamic monitoring scenarios for our apps and infrastructure. This solution very much reminds me of building out System Center Operations Manager (SCOM) Distributed Applications. If your interested in workbooks, I have other workbooks you can use in your environment on my github.
