At Microsoft the data from attacks that we see against our cloud services informs our security research and investments. Microsoft uses this data, and other sources, to track emerging threats as well as to improve the detection coverage of our security offerings. The results of this benefits customers through products such as Azure Security Center and Azure Sentinel.
In order to support security research Microsoft has open source tools like msticPy, a set of utilities for threat hunting and investigation as well as a large set of queries and Juypter notebooks for Azure Sentinel.
When researching and developing detection techniques, sourcing attack data: to train machine learning models and for use as test data, can be a challenge. To help drive pro-defence research and innovation in this area, Microsoft is releasing data from attacks against our IoT honeypot sensor network from a four-month period in 2019. We are releasing this under the in the hope that this enabled further academic research in this area.
The data
This dataset comprises of over 125 thousand different Unix/Linux command sequences. We have seen these over 150 million times across Microsoft’s vast attack collection network. These attacks range widely in complexity. In some cases, we’ve caught malware under development, other times robust attacks. This dataset details all the commands executed, ranging from just a single command to over 700.
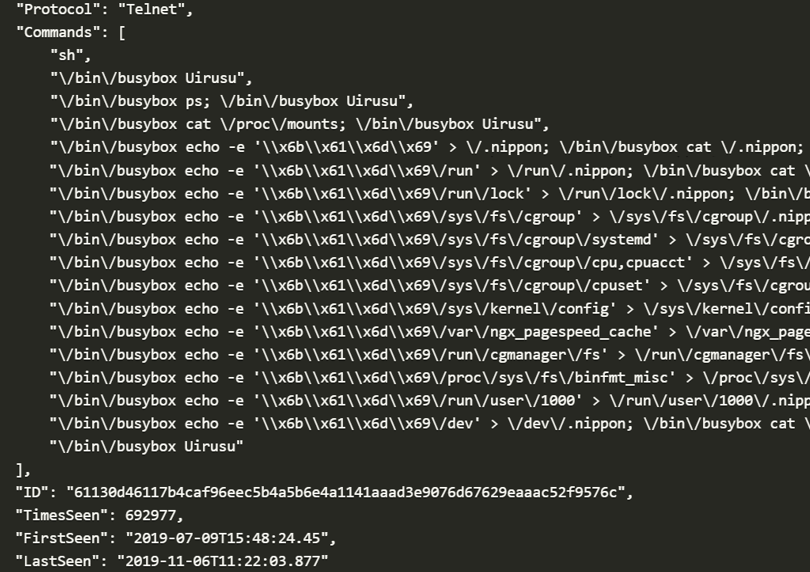
The data we are releasing is JSON formatted, like the sample below
Aside from the commands issued by the malware itself, each sample has: a SHA256 ID, the number of times the sample was seen on our sensor network as well as the first and last seen times. Due to the potentially malicious URLs in the data we are releasing the ZIP file with the password of ‘infected’. Please handle with care.
You can load this data into any database that can accept JSON blobs. In the rest of this post I’ll show how you can import this data into Azure Sentinel for faster analysis. If you are not an Azure customer the data is still available to you from the Azure Sentinel Github repository within the ‘Sample Data’ directory. There are also several programs for developers and students that allow you to you to experiment with Azure for free.
Getting the data into Sentinel
To import this data (or any JSON data for that matter) into Azure Sentinel there is a tool under ‘DataConnectors/JSON-Import/dotnet_loganalytics_json_import’. The README.md in this directory has simple build instructions to follow. Once built, run the executable with your Azure Sentinel workspace ID, key, and name for the table. The data file will be uploaded.
Exploring the data
Once the data is in Azure Sentinel you can write queries in a language called Kusto. Kusto suits security related data well and is used extensively in Azure Sentinel to query data and build analytics. You can correlate this source of known bad data with your own logs to discover potential security issues in your environment.
The query below extracts IP addresses and DNS names from the malicious commands that we’ve collected. It does this by processing each command for what looks like the start and end of a URL or IP address.
| extend Cmds=parse_json(Commands_s)
| mvexpand Cmds
| extend CommandStr=tostring(Cmds)
| where CommandStr contains “://” or CommandStr contains “wget ” or CommandStr contains “curl ”
| extend StartOfHttp = indexof_regex(CommandStr, “http://”)
| extend StartOfCmd = indexof_regex(CommandStr, “(wget|curl)\\s.+”)
| where StartOfHttp != -1 and StartOfCmd != -1
| extend RealStartOfUrl = iff(StartOfHttp == -1, StartOfCmd+ 4, StartOfHttp + 7)
| extend EndOfIP = indexof_regex(CommandStr, “[\\s]|[;]|:[0-9]+|/”, RealStartOfUrl)
| extend Indicator=substring(CommandStr, RealStartOfUrl, EndOfIP – RealStartOfUrl )
| summarize Frequency=count() by Indicator
| order by Frequency desc
You can join this table of data on other sources such as: firewall, DNS logs or even Linux audit logs to create analytics in Azure Sentinel based on such queries.
Building detections
To enable alert generation for when any honeypot command lines are seen on a host, you’ll need to pull the Linux Audit events into Syslog which the OMS agent will consume and make available in the Syslog table in Azure Sentinel.
An easy way, but not production ready, is it to use some bash-fu. Running the following commands in the background on your Linux host will take the auditd entries, decode them and then add them to Syslog. You’ll need both entries to handle the two different formats auditd produces.
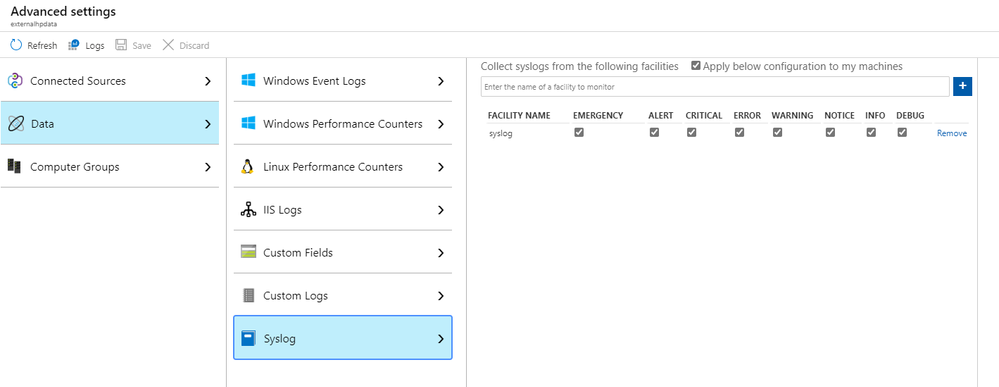
Once these commands are running, turn on Syslog integration in the Advanced Settings of your Sentinel workspace.
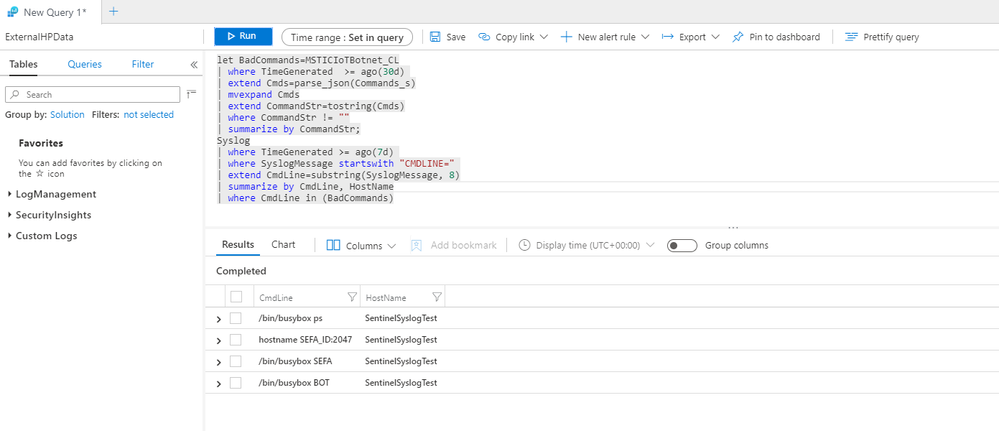
Now you’ll be able to query Linux command lines in Azure Sentinel.
The following Kusto query takes all the command lines we extracted earlier and compares them to the audit records added to Syslog.
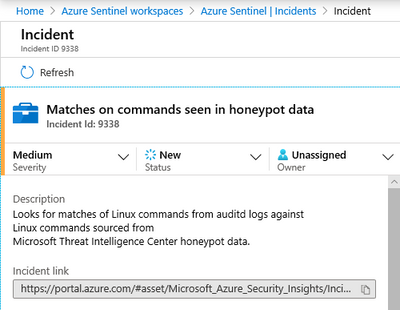
Configuring such a query as an Azure Sentinel analytic will result in an incident being raised if a match occurs:
As another example of the kind of query you can do, the next query will look across all the data and calculate the longest and shortest attacks.
| where TimesSeen_d > 5 // only track bots
| extend totalTime=LastSeen_t – FirstSeen_t
| extend seconds=format_timespan(totalTime, ‘s’)
| extend minutes=format_timespan(totalTime, ‘m’)
| extend hours=format_timespan(totalTime, ‘h’)
| extend days=format_timespan(totalTime, ‘ddd’)
| extend totalSeconds=toint(seconds) + (toint(minutes) * 60) + (toint(hours) * 60 * 60) + (toint(days) * 24 * 60 * 60)
| summarize LongestCampaign_days=max(totalSeconds)/60/60/24, AverageCampaign_days=avg(totalSeconds)/60/60/24
Microsoft’s Threat Intelligence Center proactively uses data sources and techniques such as those described here to discover emerging threats, as well as to ensure that our detection coverage is relevant to the attacks facing both Microsoft and its customers. You can use data sources like the one described here, your cloud-based assets and Azure Sentinel to hunt for and investigate your own threats.


