This post has been republished via RSS; it originally appeared at: New blog articles in Microsoft Tech Community.
Azure Sentinel and Azure Security Center both contain fantastic security features. There are many interactions available between the two products that can maximize Sentinel’s abilities as a SIEM and SOAR solution. Unknown to many, there is a way to utilize some of the features from Azure Security Center in a Sentinel workbook. A new Sentinel workbook that has been posted on my personal Github enables users to utilize logs and features from Azure Security Center to assist with investigation, resource tracking, and compliance.
This new workbook allows SOC Analysts to utilize security posture and endpoint logs to monitor trends for compliance, endpoint protection events, or security recommendations that may be related to existing incidents and investigations. Below is a guide on how to use the Compliance workbook and a description of its requirements.
Prerequisites:
- Azure subscription: https://azure.microsoft.com/en-us/free/
- Azure subscription onboarded to Azure Security Center: https://docs.microsoft.com/en-us/azure/security-center/security-center-get-started
- Continuous Export set up in Azure Security Center: https://docs.microsoft.com/en-us/azure/security-center/continuous-export
- Proper RBAC role and permissions: https://docs.microsoft.com/en-us/azure/security-center/security-center-permissions, https://docs.microsoft.com/en-us/azure/sentinel/roles
- Log Analytics workspace: https://docs.microsoft.com/en-us/azure/azure-monitor/learn/quick-create-workspace
- Azure Sentinel: https://docs.microsoft.com/en-us/azure/sentinel/quickstart-onboard
The workbook contains the following tabbed pages:
- General (data ingested)
- Alerts and Incidents (Incidents coming soon)
- Compliance and Posture
- Endpoint Updates and Protection
- Qualys
- File Integrity Monitoring
Note: When setting up the workbook, please make sure to select a subscription, workspace, and time range to work with. Each tab and their tiles rely on these pieces of information.
General
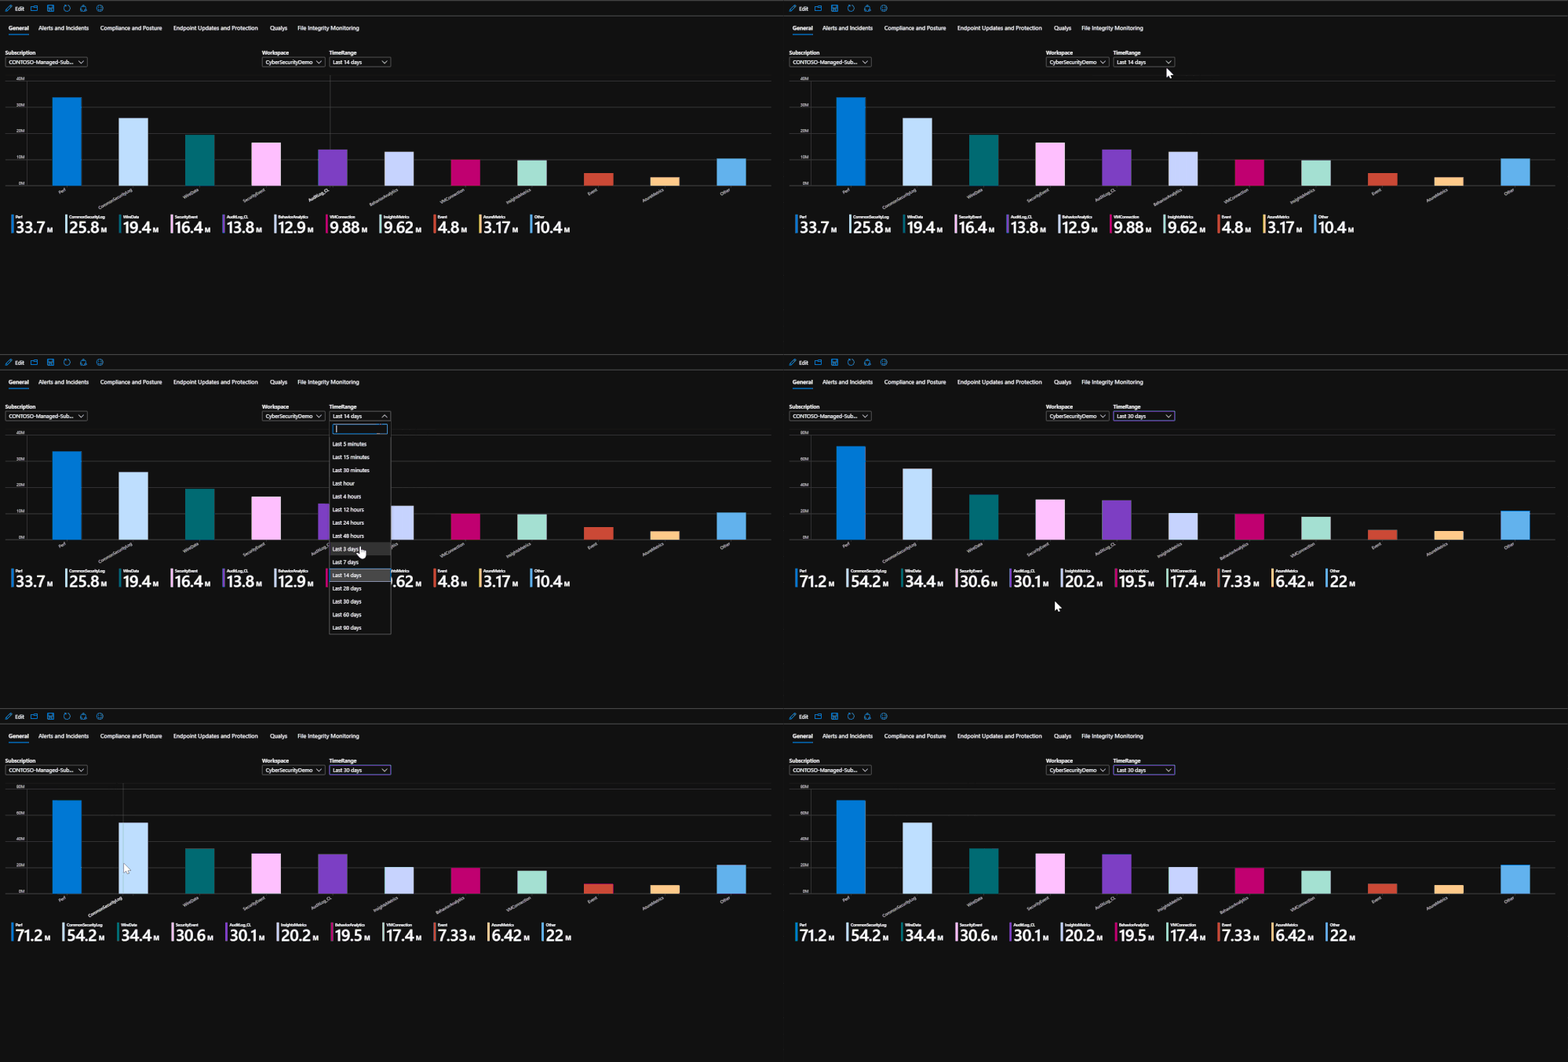
This tab is the landing page for the workbook. This tab serves to be a general page that shows exactly how much data you have ingested into the workspace for the selected time range.
Alerts and Incidents
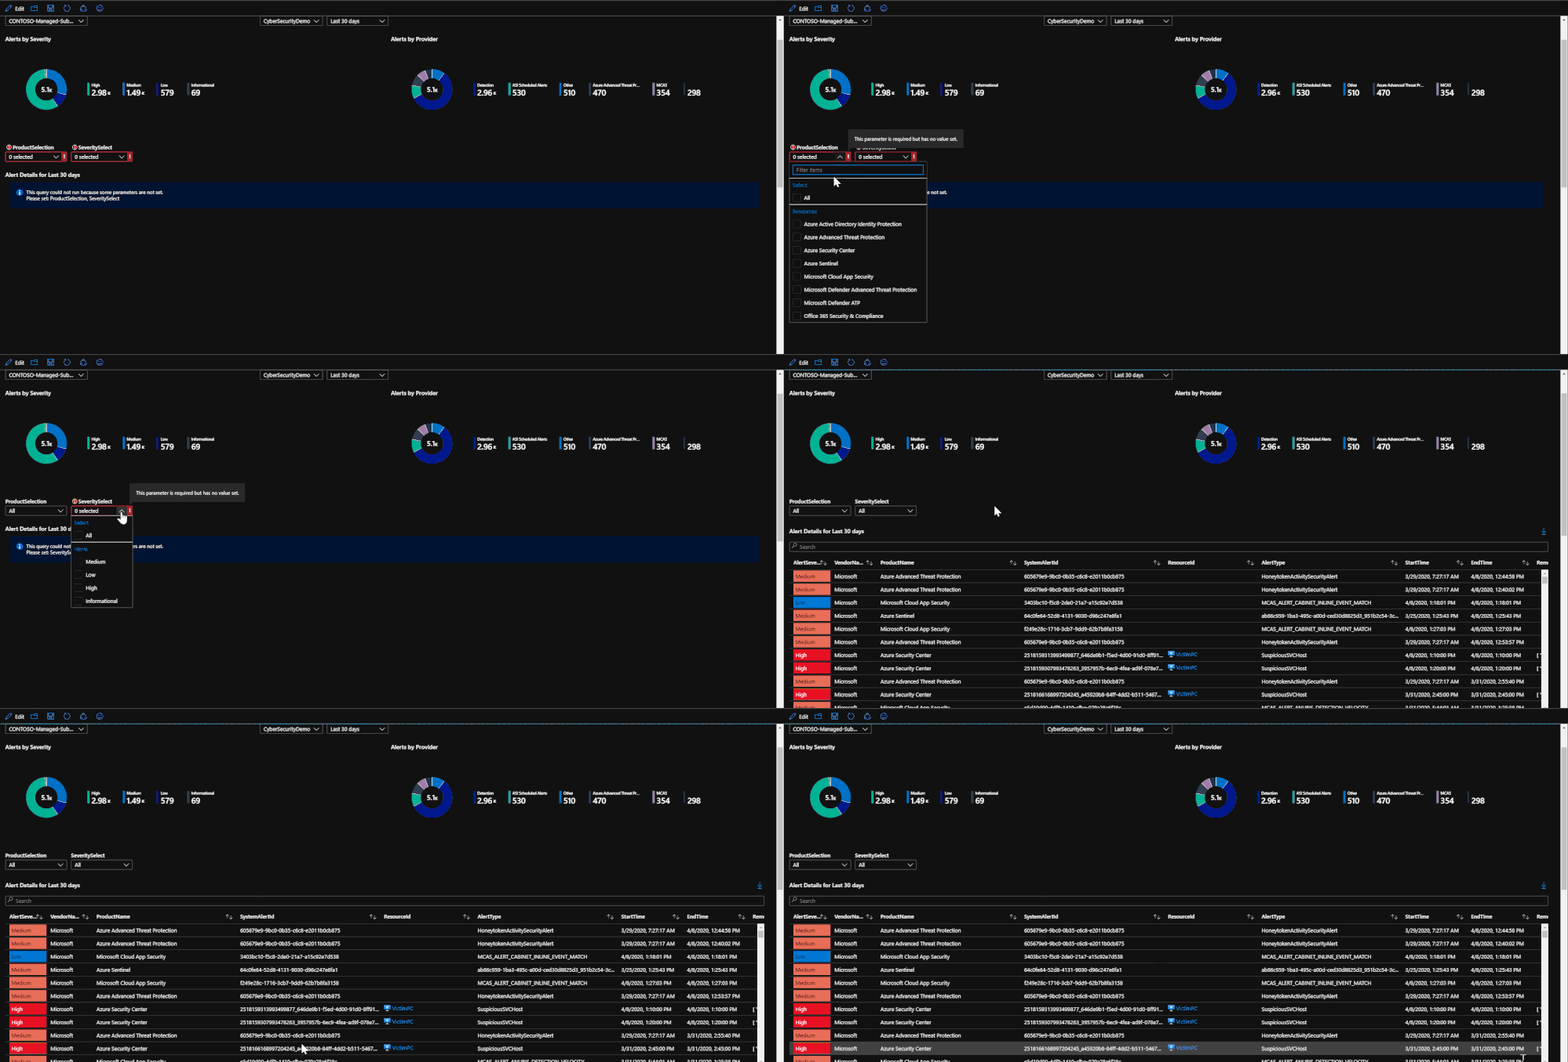
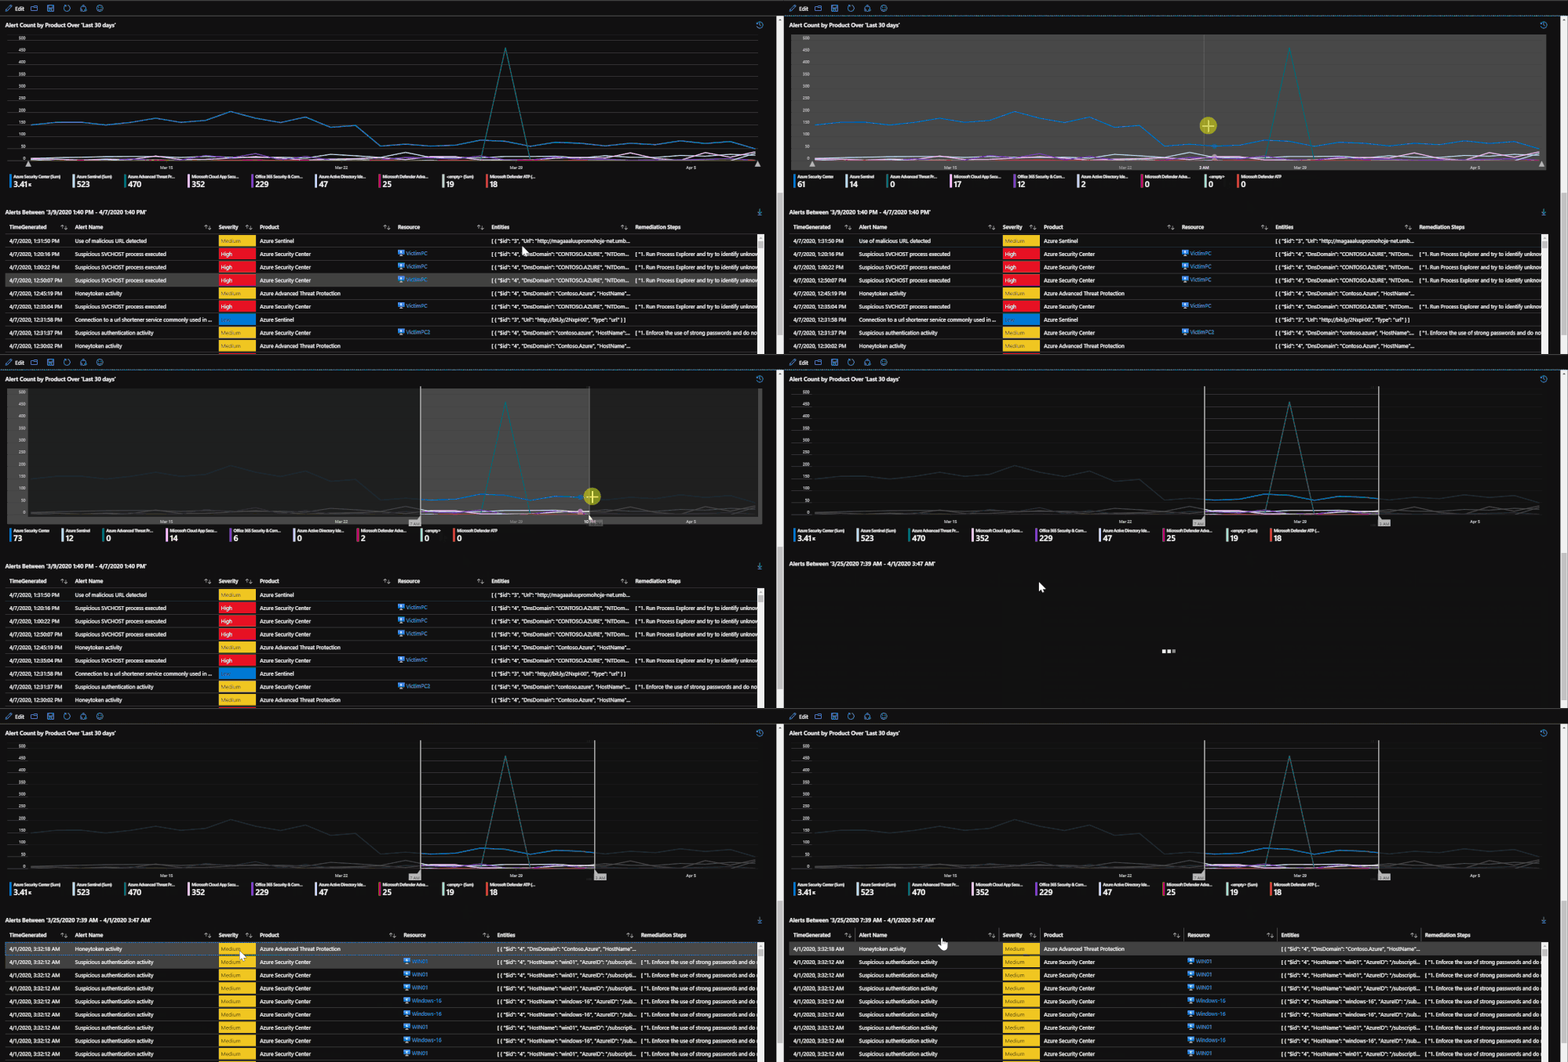
This tab of the workbook contains a list of alerts for the specified time frame that is chosen. The purpose of the tab is to provide an easy to use interface for reviewing and investigating alert trends for a specified time range. At the moment, incidents are not included but this will be changed in the coming months. Once a subscription has been chosen, you can specify the source product and the severity of the alerts. Once that has been done, the alerts for the time frame chosen will be listed with information such as title, which security product raised it, which resource has been impacted, remediation steps, and a link to the alert for more details if needed. For reporting purposes, these alerts can be exported to Excel by using the download button above the grid that contains the alert logs.
The second half of the page deals with selecting a time frame on a time chart in order to narrow down which alerts were raised in that time frame. This ability allows you to specify a time frame for alerts in order to investigate trends or peaks that are anomalous. This is done through a feature called "time brushing" and can be done by clicking and dragging on the time chart in order to set the range. This allows the user to consistently change the range when reviewing data without having to reload the page multiple times.
Compliance and Posture
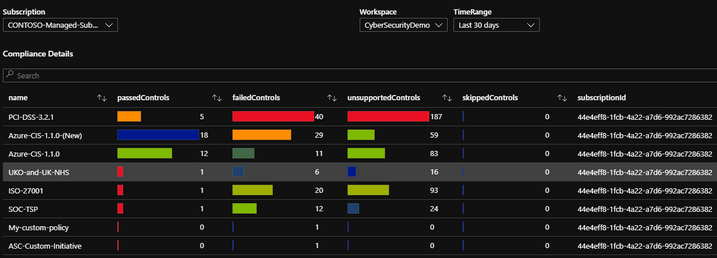
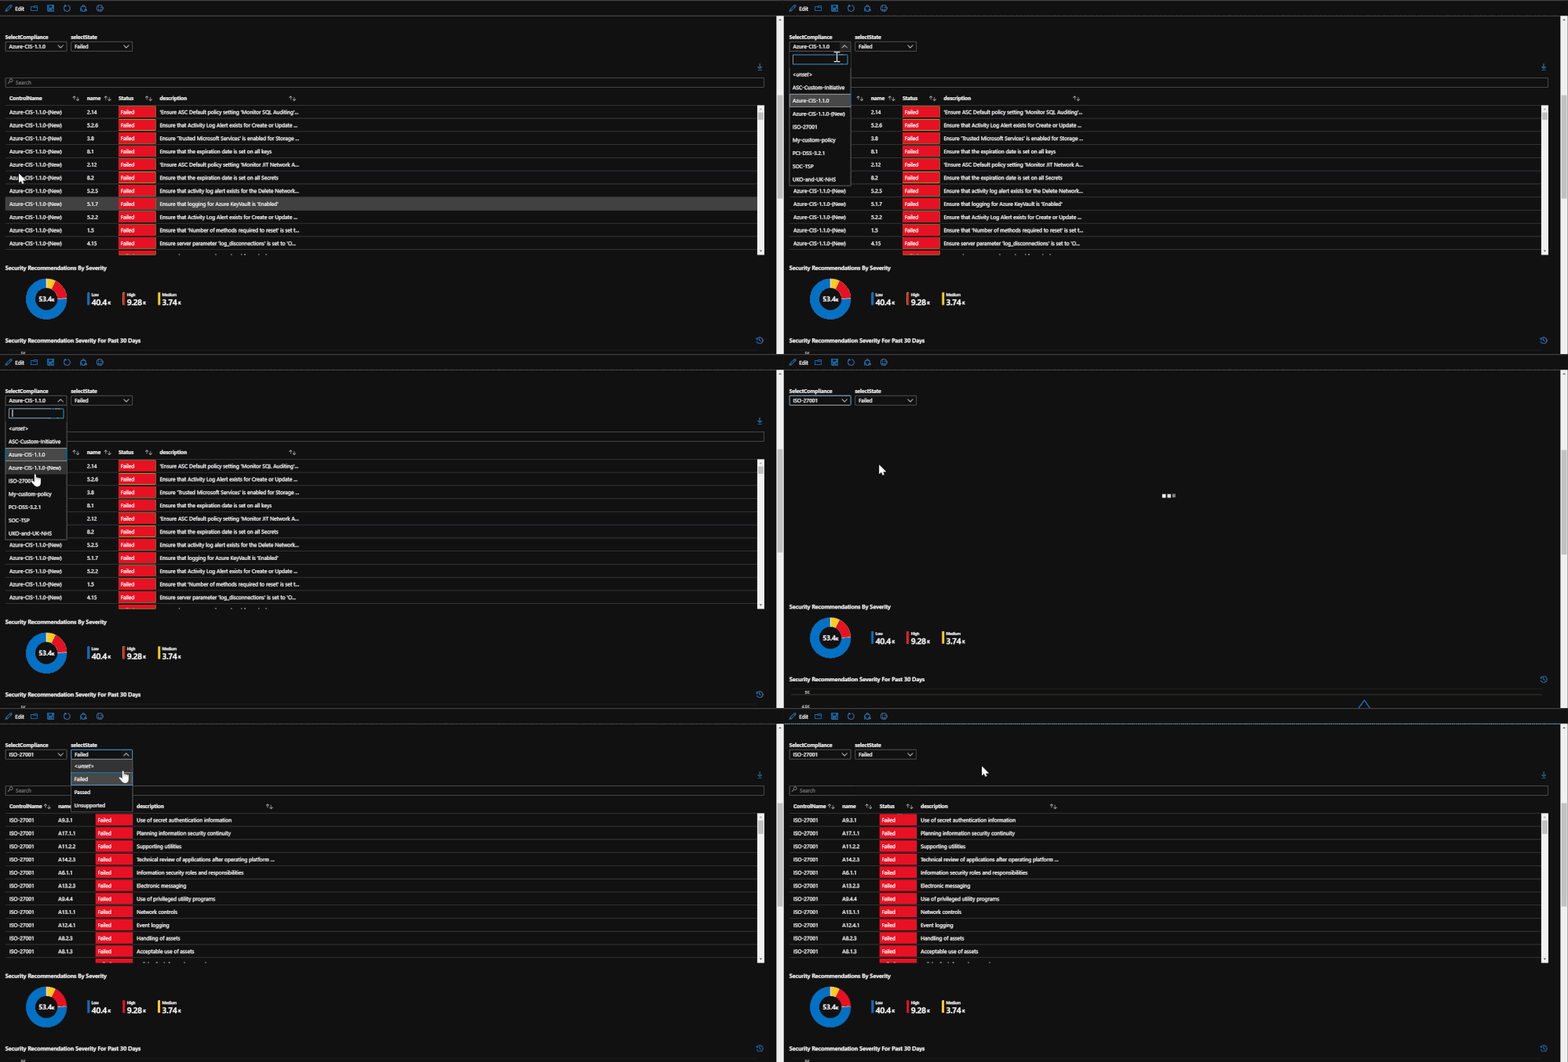
Within the compliance tab, the compliance statistics for each regulation is listed with the amount of passed, failed, and irrelevant checks. This is used to show how compliant your subscription is with each regulation standard.
If you would like to break down each regulation, there is an option to select a single regulation and break down which regulation checks that are failing. This will help keep track of which checks need to be addressed. This list can be exported to Excel for reporting.
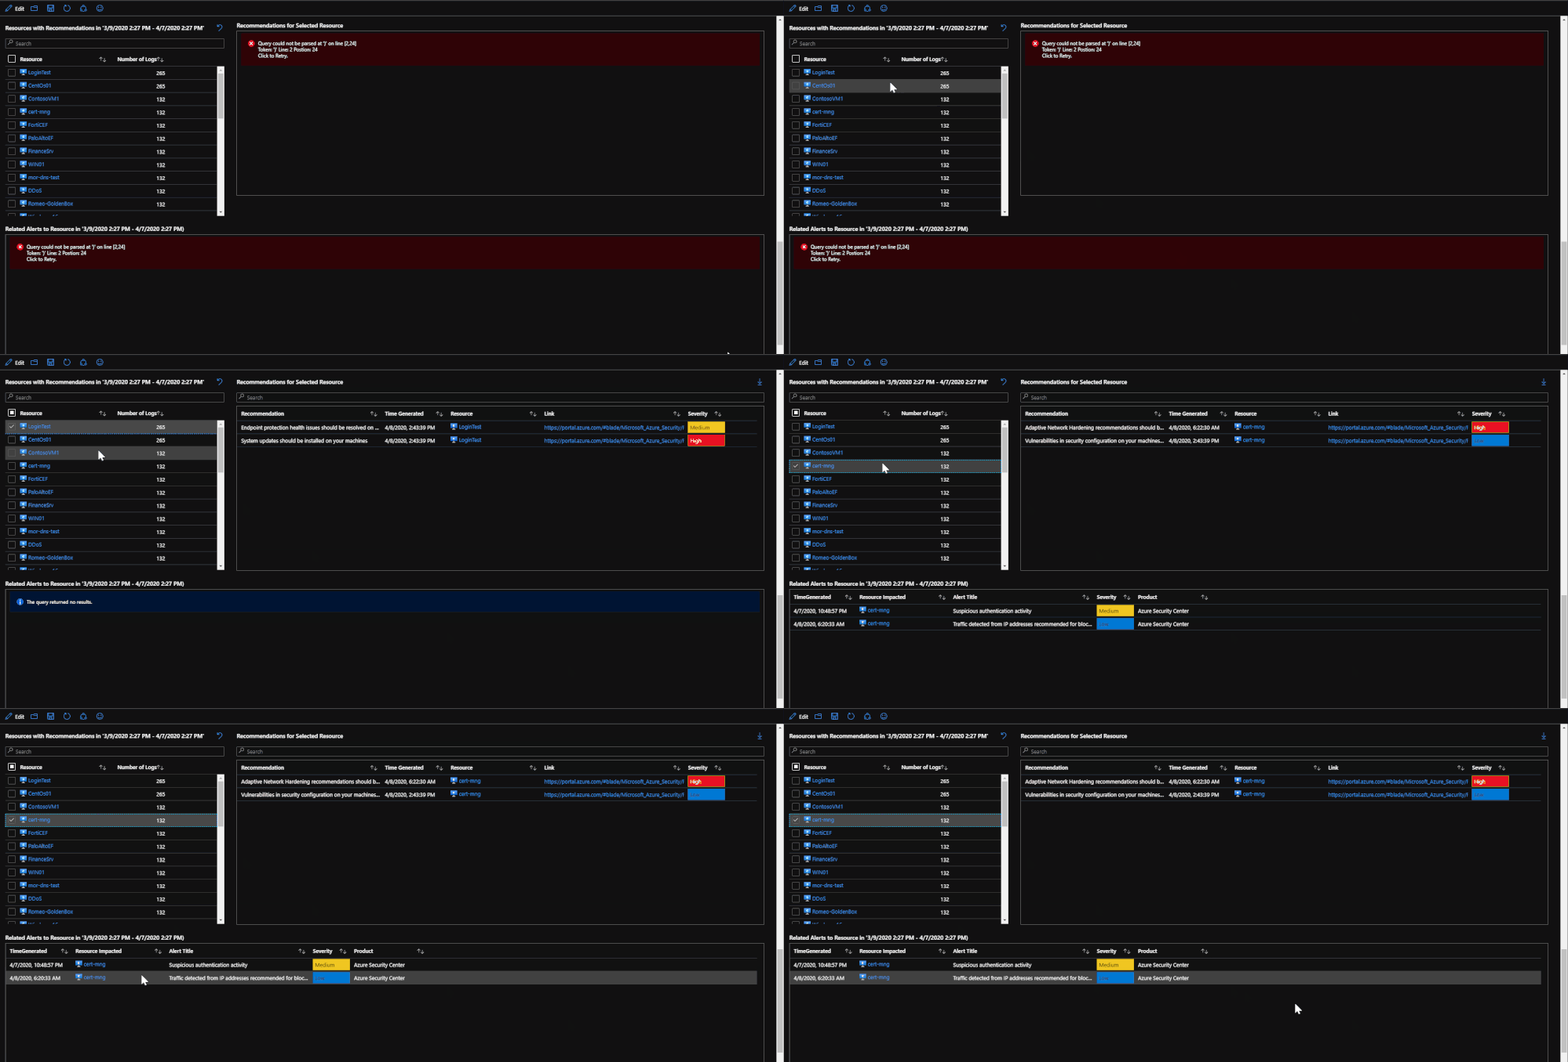
Beneath the regulatory compliance section, the workbook breaks down recommendations more to the resource level. There is a time chart that lists the time trend based on the time specified. This time chart also allows for time brushing to allow users to narrow down the recommendations to be within only that time frame. Once a resource has been selected, the recommendations for that resource within the time frame will be presented as well as any related alerts. The purpose for this is to present recommendations that may be related to security alerts or incidents that might have taken place.
Endpoint Updates and Protection
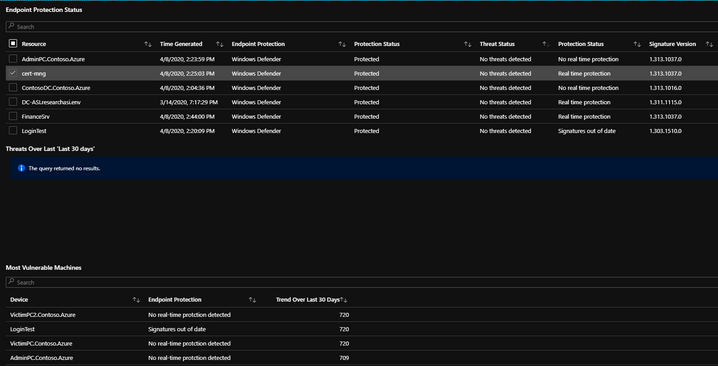
The endpoint protection section will show you the most recent log from the machines pertaining to its endpoint protection status. This portion of the tab allows you to click on each machine in order to bring up additional information on protection or malicious events. Once a machine is clicked on, any related malware events that may have taken place will be brought up to show if there is any relation between protection status and malware events.
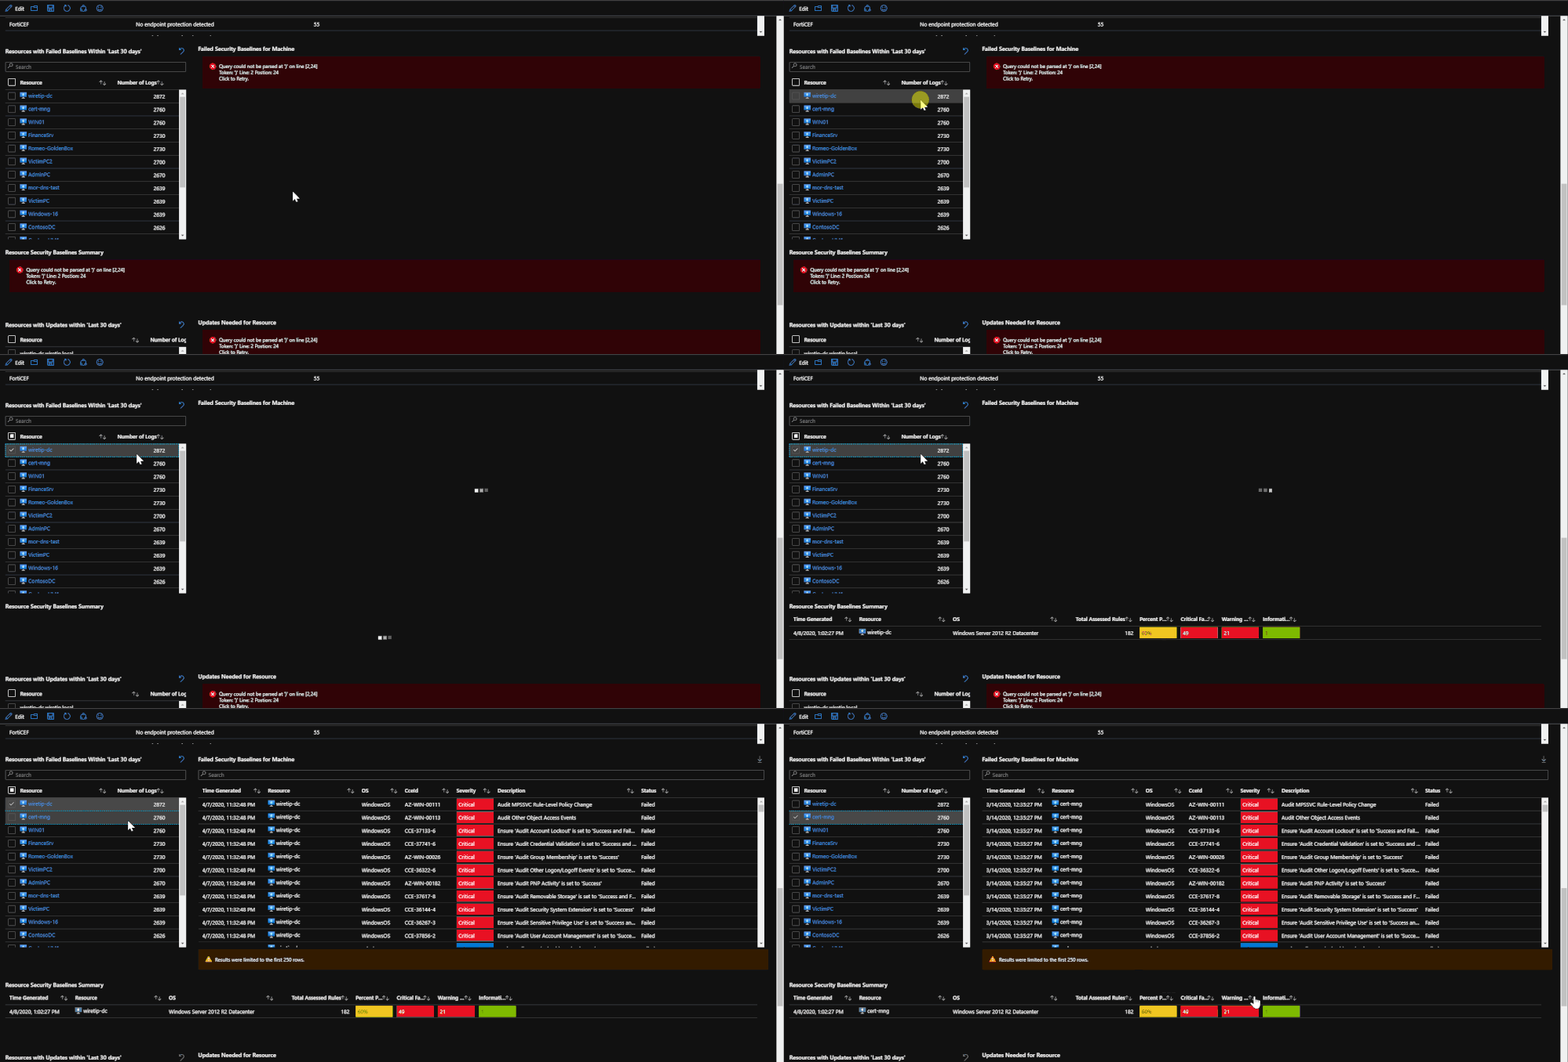
After the endpoint protection portion, machines with failed baselines are shown with each resource being clickable. Once a resource is clicked, any failed baselines will be presented with their severity, title, and status. For reporting purposes, a baseline summary is presented for the resource selected that details how many baselines there are, how many have been passed, how many have been failed, and how many are irrelevant.
(*Note: Update logs from Linux based machines will not contain as much information)
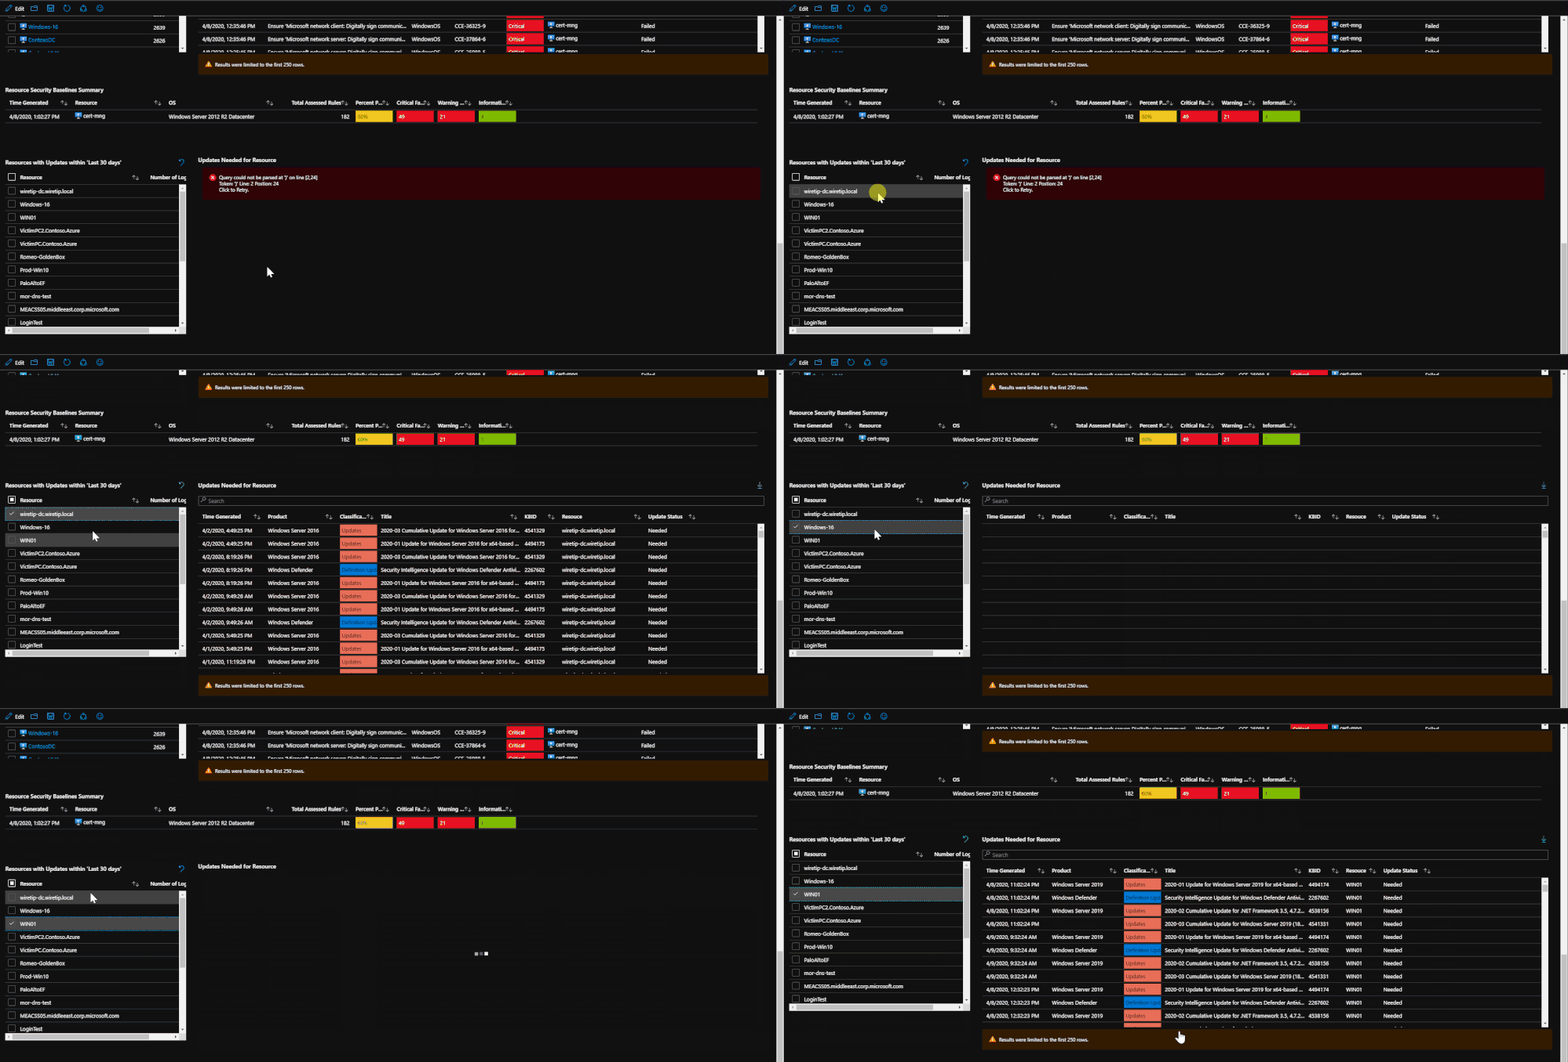
Lastly, update logs are pulled in order to show which updates are needed for the OS and the services running on the machine. The update logs come from both Windows and Linux and detail which updates need to be applied. This information can be important when tracking compliance or looking for a root cause for an attack as it may detail important updates that should have been implemented.
The information from this tab can be used for correlating failed baselines with compromises that may have taken place. For example, a failed baseline could be ‘SMBv1 should be disabled” or an important definition update for malware was needed. Should these not be addressed, it could lead to a potential security incident.
Qualys
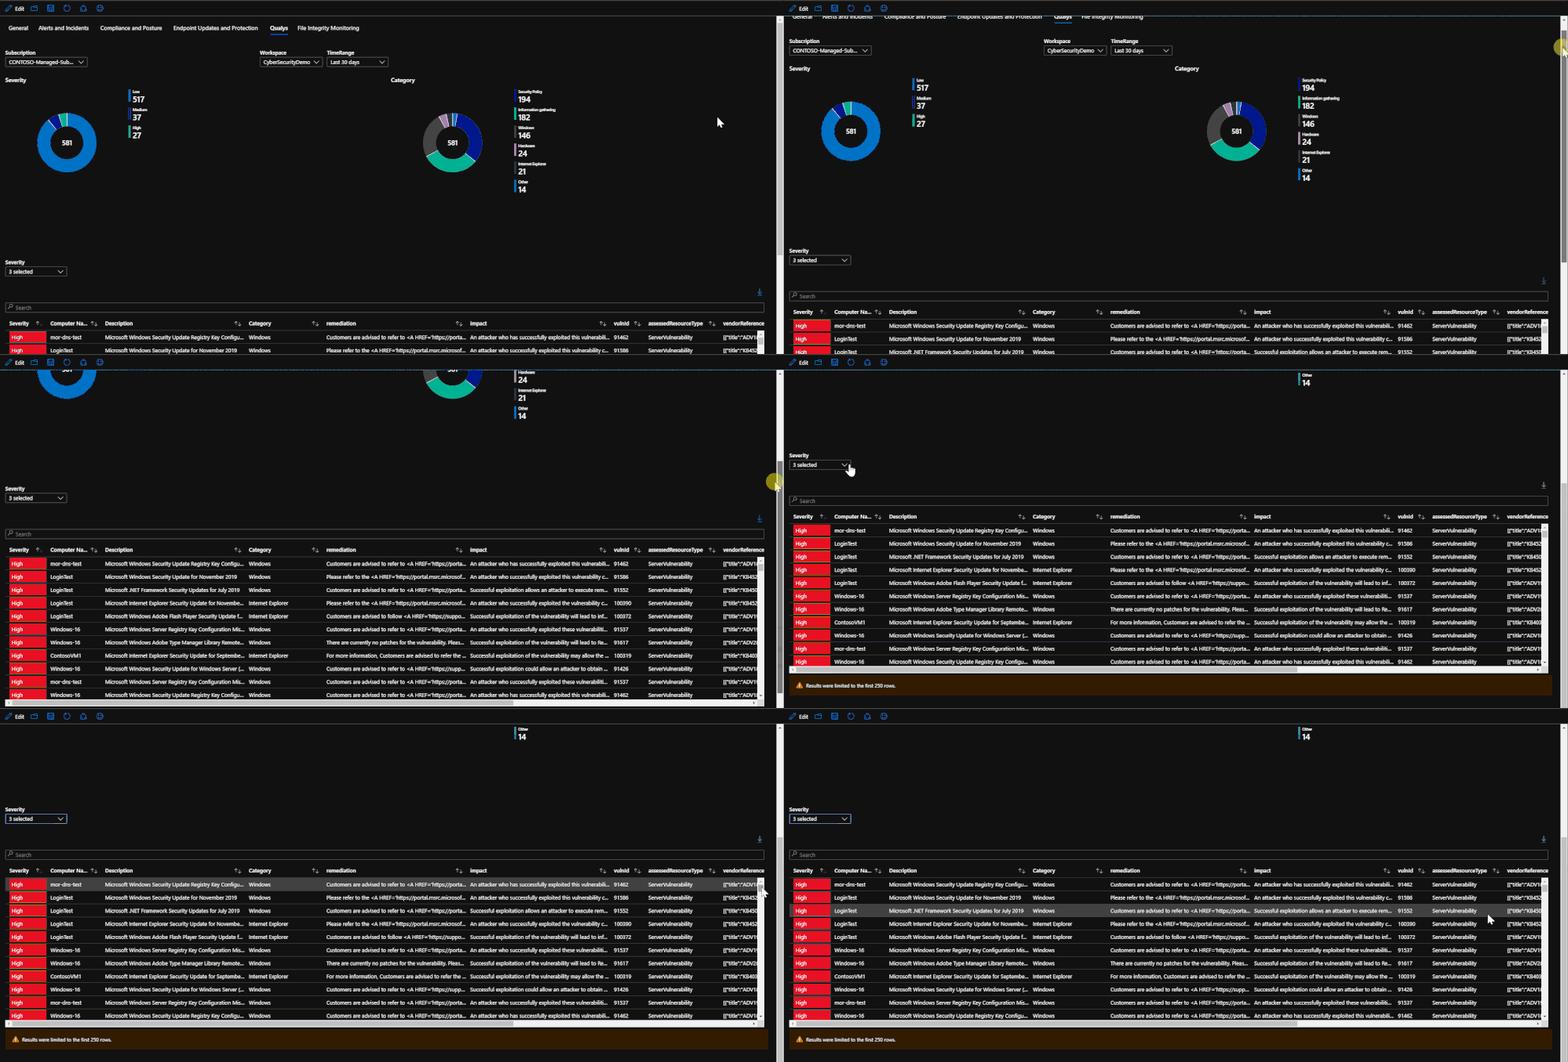
With the new offering of the built-in Vulnerability Assessment scanning solution through Azure Security Center, there is valuable information from scans that is available for viewing in a workbook. The tab within the workbook displays the assessments that fail, if they are patchable, and the severity of each assessment. Similar to the endpoint protection and security baselines, the vulnerability assessments can provide insight and useful information when investigating an incident or with finding a root cause for a compromise.
For more information about the free, out-of-the-box Qualys solution, please refer to this document: https://docs.microsoft.com/en-us/azure/security-center/built-in-vulnerability-assessment
File Integrity Monitoring
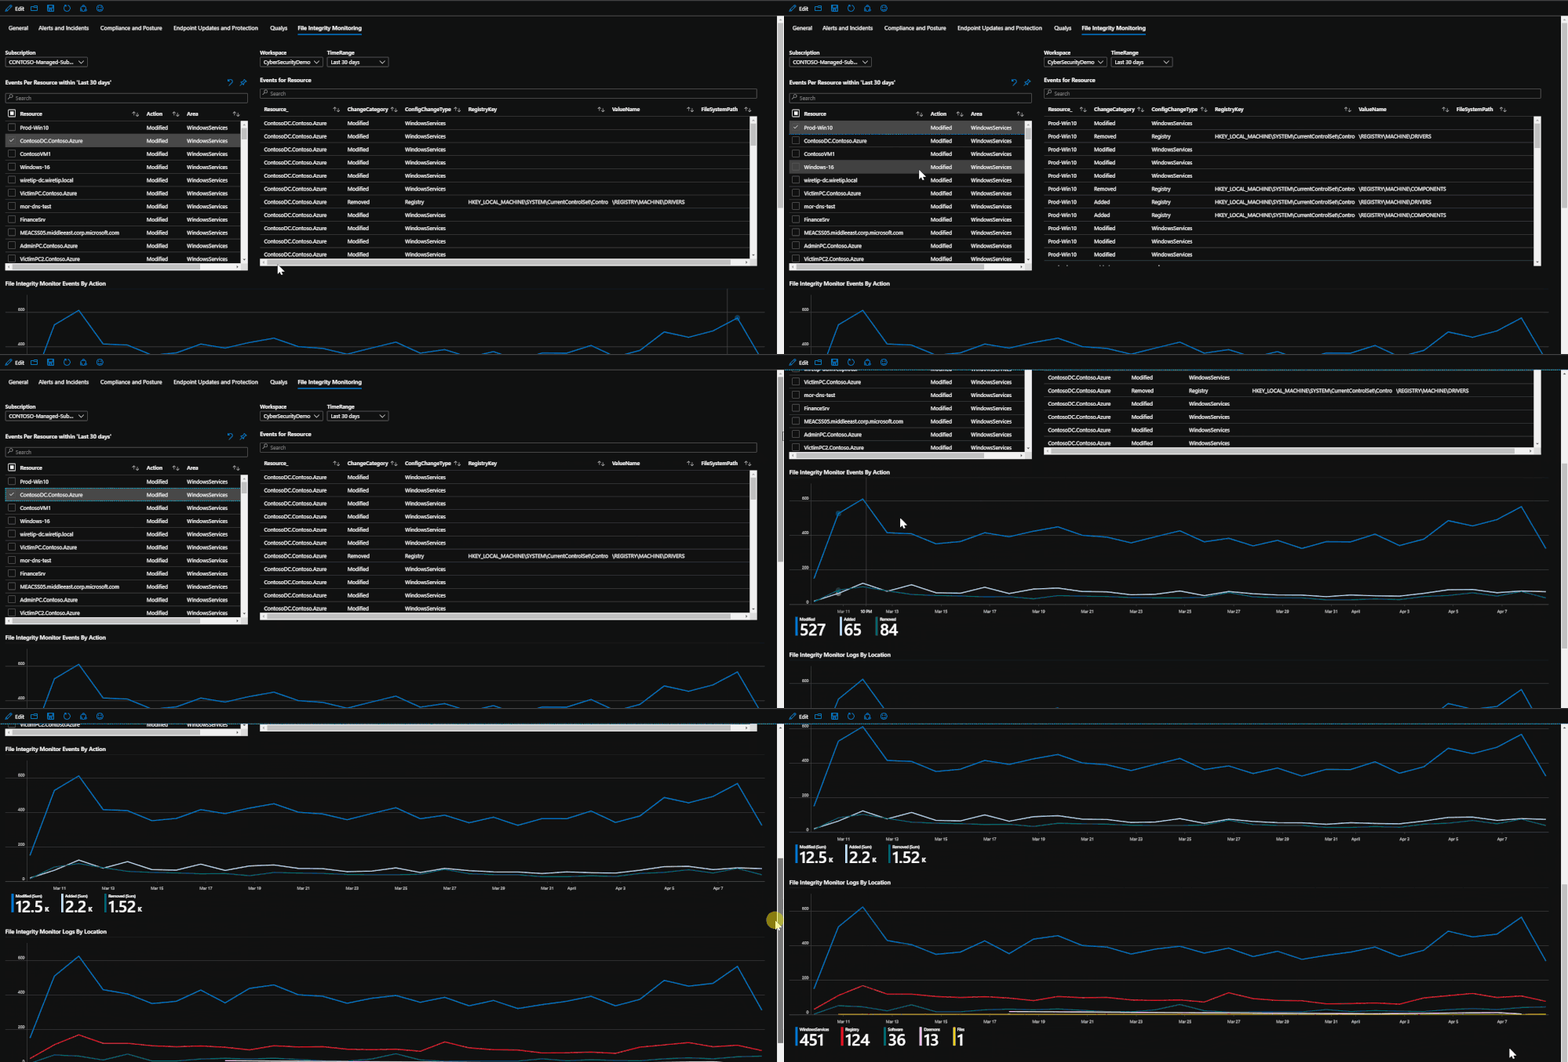
Lastly, if File Integrity Monitoring is enabled on the subscription and workspace through Azure Security Center, configuration change logs will be available depicting file, file path, and registry events that have been made. The tab utilizes these logs by presenting the events and trends that have taken place during the time range set. The events will tell which machines have been changed, which location, which action was done, and if possible, it will list the value. These logs can provide some deeper insight into attacks or malicious events that might affect valuable files or registries that should not be modified in any way.
Analytics
With logs such as protection status or configuration change, users can utilize these logs in the Analytics Section of Sentinel by creating custom rules that can pull the details needed or utilize playbooks to address the alerts. An example would be to pull security baseline logs where they status is failing, and the title pertains to SMB. With this, you can deploy a playbook to send a notification with details and the associated assignment
Conclusion
This workbook was made on top of work done by Clive Watson. If you would like to see his original blog post about his work, you can view it here: https://techcommunity.microsoft.com/t5/azure-sentinel/compliance-reporting-for-azure/ba-p/1259574
Azure Sentinel allows users to be versatile and this workbook is a prime example of it. With workbooks, you can create anything that you want as long as the logs, API, or resources exist. This blog and workbook serve to be prime examples of how that can be achieved and just how powerful workbooks can be in the day to day operations of a SOC.
Please give the workbook a try and let us know how you are using it and how you might make it better!

