This post has been republished via RSS; it originally appeared at: New blog articles in Microsoft Tech Community.
Widely requested by our customers, the most recent Update Staging Lab update delivers a powerful new feature that makes it easy to understand the resource utilization for applications enrolled in the Update Staging Lab service.
Despite the challenges imposed by the recent global health challenges, our team of engineers have been working hard to bring you this capability, along with other user interface (UI) updates. Read on for more details or watch this video for a quick walkthrough of the latest improvements. Want to onboard your application to the Update Staging Lab and accelerate validation against Windows security updates? Visit https:://aka.ms/JoinUSL to sign up or recommend your ISV for the service.
Process level performance metrics
The Update Staging Lab dashboard offers performance metrics for all processes that run on the test machine along with your application. These details are included in the “Memory utilization” and “CPU utilization” panes of the dashboard. With the latest update, you can now analyze these performance metrics, along with an associated timeline, for each process.
Performance metric details for individual processes are included in the event trace log (ETL) file for analysis. These can be opened using the Windows Performance Analyzer (WPA), a tool included with the Windows Assessment and Development Kit that creates graphs and data tables of Event Tracing for Windows (ETW) events.
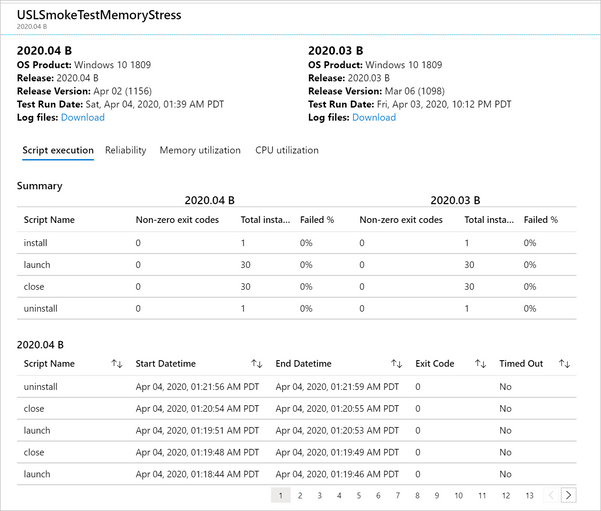
For example, let's say I onboarded an application called Update Staging Lab Smoke Test Memory Stress. If I want to drill into the resource utilization of the application during the latest Update Staging Lab test run, I can do so by downloading the ETL file using the log files Download link as shown below. (The ETL file is included in the zip file downloaded.)
Figure 1. How to download log files (including the ETL file) in Update Staging Lab
Figure 2. An example of what the ETL file will look like in the downloaded log files folder
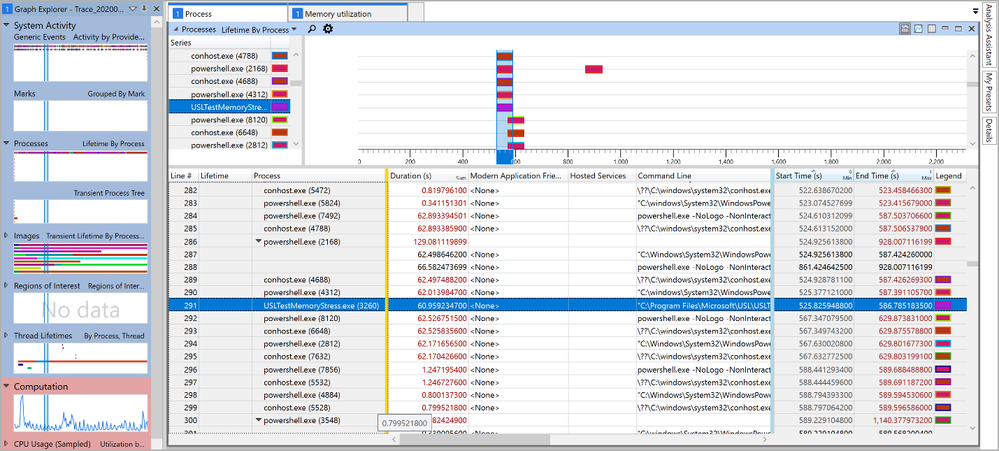
The ETL file contains details of all individual processes that ran on the machine along with my application. It can be used to drill further into specific application processes. In this case, let's say I am interested in Update Staging LabTestMemoryStress.exe, which executed at multiple times during the test run.
Figure 3. An example of the detailed look into a specific application process
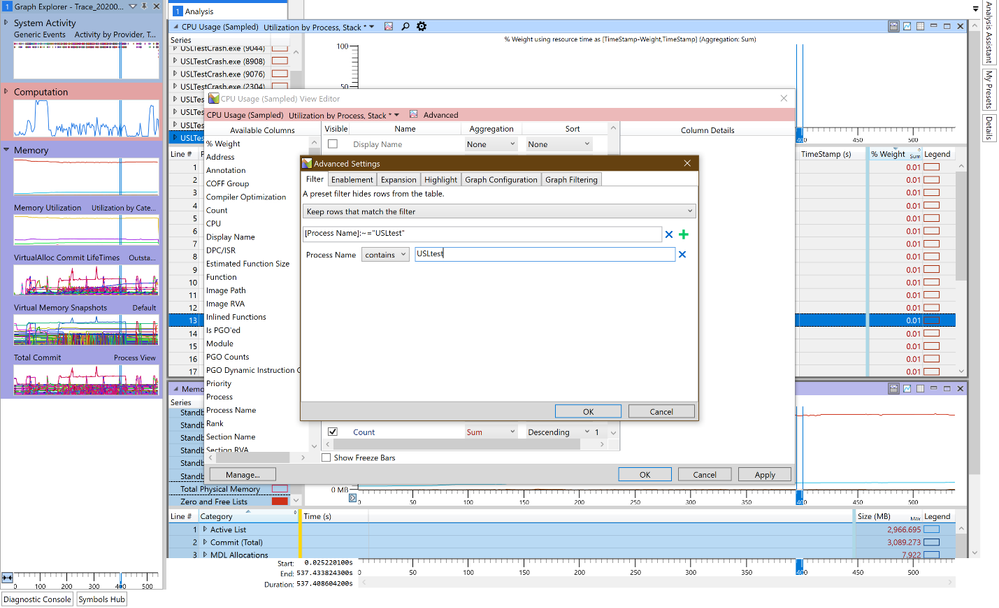
Looking at the ETL file, the Graph Explorer on the left shows all the metrics available. From here, I can analyze System Activity, such as processes or computations such as CPU usage. I can also search for, and isolate, specific processes using advanced settings. For example, to look for Update Staging LabTestMemoryStress.exe, I can simply filter for process names with the text “Update Staging LabTest”.
Figure 4. Searching for a specific process name
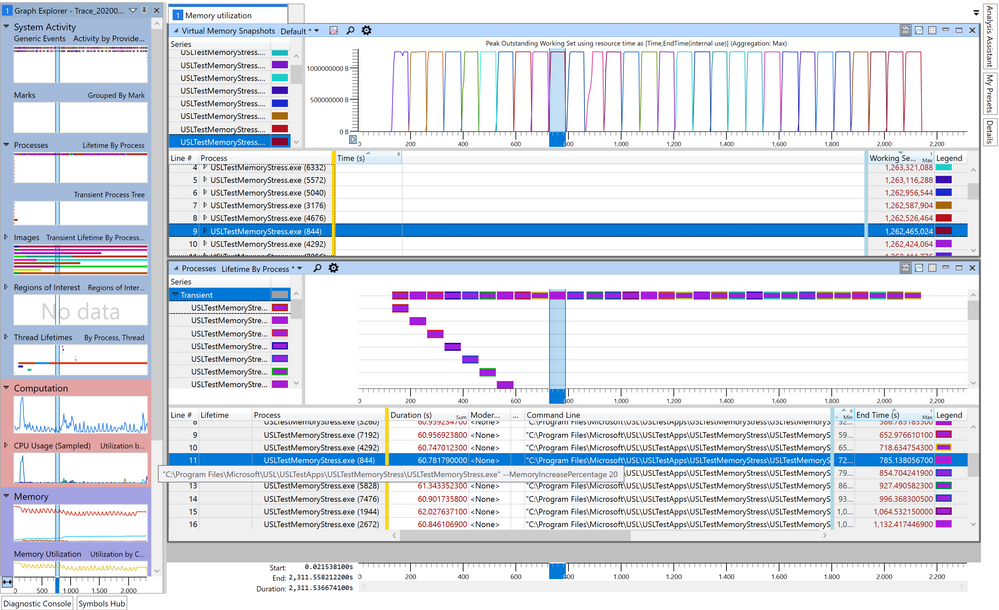
In the example above, I filtered for the Update Staging LabTestMemoryStress process and aligned the process timeline with the virtual memory snapshot. By choosing a specific instance of the process execution (instance 844), I was able to note the process start time, end time, duration, peak working set, and memory increase percentage.
Figure 5. Details on a specific execution of the process; the “Command Line” cell denotes a 20% increase in memory caused by the process.
Furthermore, presets can be saved and exported as a profile. By saving this profile, all new ETL files can be opened with the profile selected and the default views. In addition to the memory snapshot, you can overlay CPU utilization details with the process timeline.
With these ETL files, our goal is to ensure you have visibility into process-level information and the ability to isolate and analyze issues. This is a key tool to help you find the cause of any potential performance issues. Analysis of these processes using the ETL file can be further enhanced by favoriting your processes in the Update Staging Lab dashboard. We plan to continue to provide you more tools to help analyze performance issues as well as include a clear status based on regression analysis results.
Additional dashboard and service updates
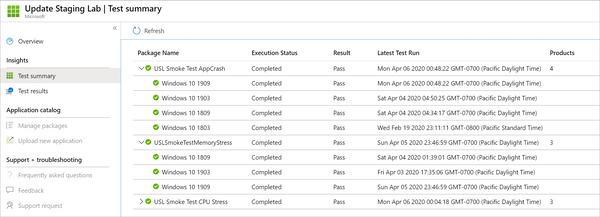
In the latest Update Staging Lab update, we have also introduced test run completion details in the test summary page. With this update, you can look at the most recently available results without clicking into individual test runs.
Figure 6. Information about the date and time of the most recent test run
In addition, Update Staging Lab now supports restarts at the end of your scripts. These restart requirements can be specified in your application package when you upload. This is a critical tool to support your existing test infrastructure on Update Staging Lab, which might require restart injections at specific junctures.
Private preview participants can start using these enhancements today in the Update Staging Lab dashboard within the Azure portal. We are working on additional UI and service-level improvements and are excited to share details on those soon.
Our lives have changed drastically in the last few months due to the current public health situation. It is vital now, more than ever, to use technology to the fullest to make your work easier and more efficient. We, in the Update Staging Lab team and at Microsoft, are working hard every day to make that happen. Please try out Update Staging Lab and the latest features we added and let us know how we can continue to do so. Please provide us with feedback in the comments section below or email us at uslpreview@microsoft.com.

