This post has been republished via RSS; it originally appeared at: New blog articles in Microsoft Tech Community.
Ask and you shall receive! Many of you have expressed that you’d like to modernize the way in which you monitor your workloads. Well, now you can use SCOM to do just that with a modern UI similar to that shown in the Azure portal. In addition to a beautiful new view of your workloads, you can also filter on resource groups and resource types, just like in the Azure portal!
Azure Management Pack (MP) enables you to monitor subscriptions and resources i n a consolidated manner, which can save you time and increase efficiency. Your organization may have multiple subscriptions with thousands of resources being monitored from SCOM and as an operator you might be responsible to monitor them. In that case, you’ll want to segregate resource groups and resources of subscriptions from one another. The SCOM console shows you alerts and the state of all collectively under one view, but the limitation is you cannot filter these based on subscription and resource group, like how you do it in portal. With the new dashboard this limitation is solved.
Here is an overview of the benefits of the new dashboards.
- You can view Azure resources in SCOM in the same way as you can in the Azure portal.
- You can filter and locate your resource from thousands of resources in SCOM in seconds.
- You can view details on your subscriptions, resource groups, and alerts for every Azure resource you see in SCOM.
- You can have clean and modern dashboards with sorting, pagination, filtering, and search functionality for ease of use.
In order to see these beautiful new dashboards, you must be upgraded to SCOM 2019. Here is a link to the Azure MP along with a guide to help you install and set it up. For the folks who are new to Azure MP, Azure MP shows alerts and performance data of Azure resources in SCOM. You can refer to the Azure MP guide or my blog for more details.
Now let's see what these cool new views look like and where they can be found.
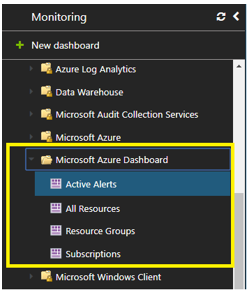
Yes, you’ve guessed right! You can see these new views in SCOM web console http://<managementservername>//operationsmanager under the Microsoft Azure Dashboard.
There are self-explanatory options in the vertical or side bar, which opens the views. In this blog, I will briefly summarize each view with the help of a few images that will showcase this feature.
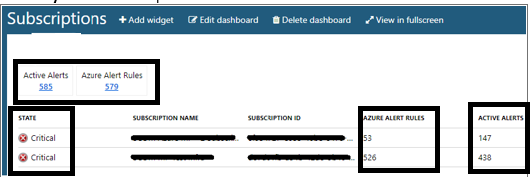
- Subscriptions View : This view shows you the overall health of your subscriptions that are monitored from SCOM. You can see the health status, active alerts and configured alert rules for each subscription. You can also click on Active Alerts to easily check why your subscription is unhealthy. I will talk more about the Alerts view later in the blog. The Azure Alert Rules link will show all the configured and enabled alerts in the portal.
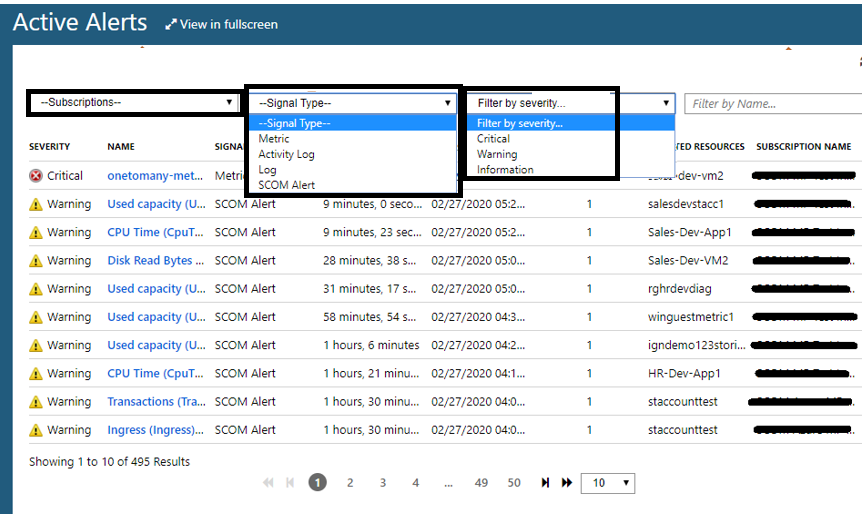
2. Active Alerts View : Similar to our known Alerts view in the console, all the active alerts are displayed here. However, in addition, this new view enables you to filter on signal type, subscription, and severity. For example, if you want to see “Metric alerts” for subscription “FinanceSubscription ” in the Critical state, you can easily view it this way. From the subscriptions drop down list, you will select “FinanceSubscription,” Signal Type as “Metric,” and Severity as “Critical.” Now you have applied filters to create this new list!
Now that you have subscriptions and alerts, you might be interested in seeing the overall health of the resource groups in various subscriptions. I will discuss this under the Resource Groups view below.
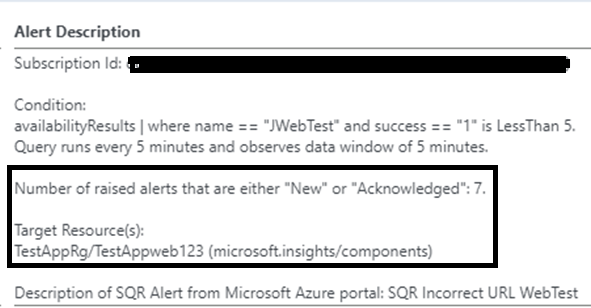
NOTE: There are some differences in how Alert counts are shown in the portal and in SCOM, and I will briefly touch on those points. You can go to the Resource Groups view if you are aware of this already.
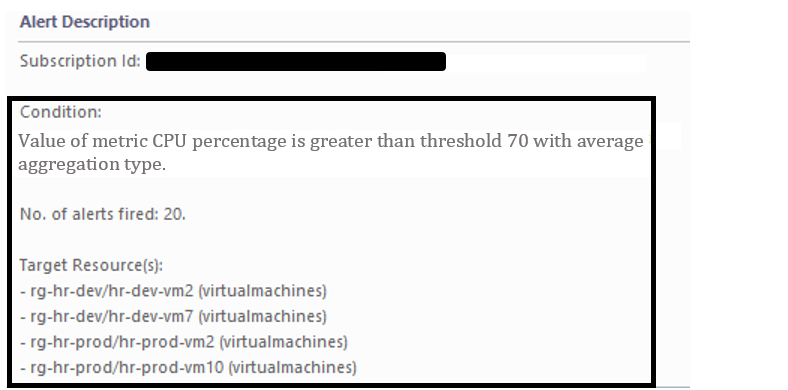
- Scenario 1: In the Azure portal you have created a metric alert with the condition, “CPU usage is greater than 70%,” to generate an alert. The target of this alert is all the VMs in the resource group for HR departments.In the Azure portal, you will see a metric alert for every VM that will meet this condition. If 20 VMs have CPU>70%, then 20 alerts will be created along with machine name. In SCOM, instead of 20 alerts, only 1 alert will be created, and the alert count will be increased and displayed as 20. The target resource will then display the name of the VMs in which the alert is fired.
- Scenario 2: You have a ping test that runs in 5 regions every 5 minutes. There is a query-based log alert defined on the availability result and when the count is less than 5, an alert is generated. The Azure portal will fire a new alert every 5 minutes (assuming there is an issue with the URL). However, since we know that you don’t want to flood your SCOM with alerts, only 1 alert will be active, and the alert count is incremental based on new generated alert every 5 minutes .
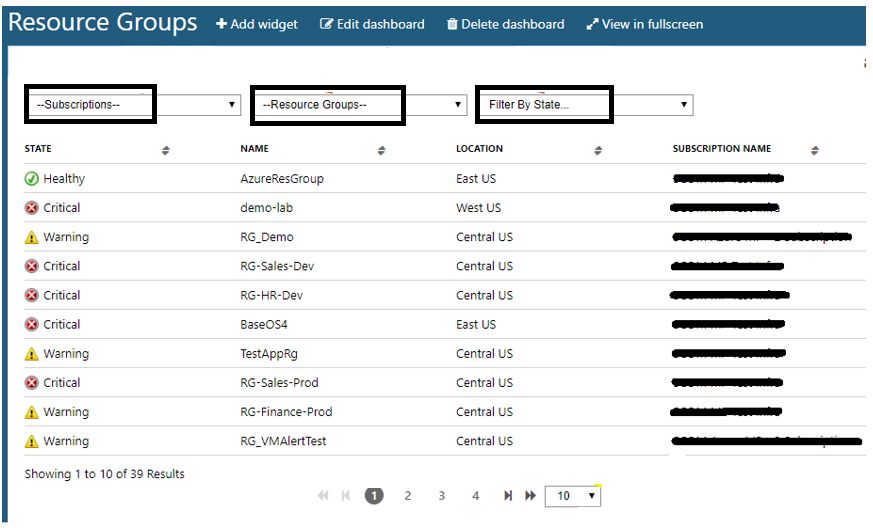
3. Resource Groups View : This is a very simple and useful way to show the health of all resource groups for monitored subscriptions. Here is a way to see whether there are unhealthy resources in “Backup RG” where all of the servers are allocated for crucial data backup. For Subscription ABC, you will select “Backup RG” and state it as “Critical”. If there are any unhealthy resources, the state will show as critical for Backup RG.
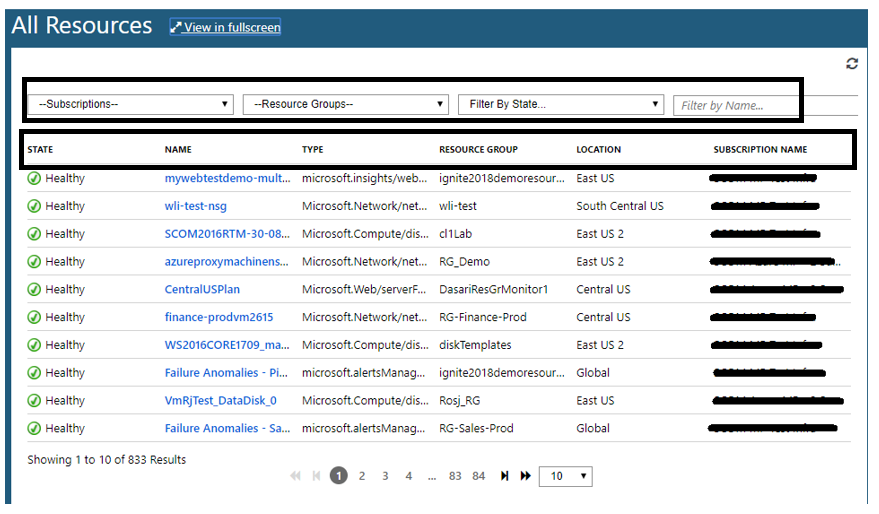
4. All Resources view : This view has all the resources that are being monitored from SCOM.
Similar to the All Resources view in the Azure Portal, you can also see the name, type, resource group and subscription details of all the Azure resources in one view within SCOM. The only additional column is “state”, which displays the health of resource.
So, what do you think? Are you all set to save time using your new Microsoft Azure Dashboards? I bet that once you use this new dashboard, you will not go back to SCOM console for Azure MP.
Thanks for reading this blog! As always, share your feedback with us through comments and on the SCOM user voice . We are LISTENING and your comments and feedback help us improve to make your lives easier! You can try out the new version here.
Stay safe and stay healthy!
Neha

