This post has been republished via RSS; it originally appeared at: New blog articles in Microsoft Tech Community.
Introduction
After creating a Kubernetes cluster and deploying the apps, the question that rises is: How can we handle the logs?
One option to view the logs is using the command: kubectl logs POD_NAME. That is useful for debugging. But there is a better option suited for production systems. That is using EFK. The rest of the article will introduce EFK, install it on Kubernetes and configure it to view the logs.
What is EFK
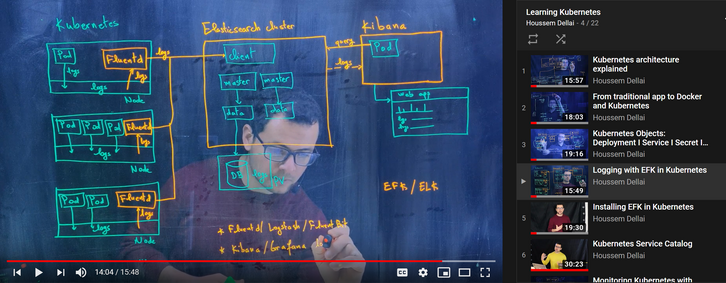
EFK is a suite of tools combining Elasticsearch, Fluentd and Kibana to manage logs. Fluentd will collect the logs and send it to Elasticsearch. This latter will receive the logs and save it on its database. Kibana will fetch the logs from Elasticsearch and display it on a nice web app. All three components are available as binaries or as Docker containers.
Info: ELK is an alternative to EFK replacing Fluentd with Logstash.
For more details on the EFK architecture, follow this video:
https://www.youtube.com/watch?v=mwToMPpDHfg&list=PLpbcUe4chE79sB7Jg7B4z3HytqUUEwcNE&index=4
Installing EFK on Kubernetes
Because EFK components are available as docker containers, it is easy to install it on k8s. For that, we’ll need the following:
- Kubernetes cluster (Minikube or AKS…)
- Kubectl CLI
- Helm CLI
1. Installing Elasticsearch using Helm
We’ll start with deploying Elasticsearch into Kubernetes using the Helm chart available here on Github. The chart will create all the required objects:
- Pods to run the master and client and manage data storage.
- Services to expose Elasticsearch client to Fluentd.
- Persistent Volumes to store data (logs).
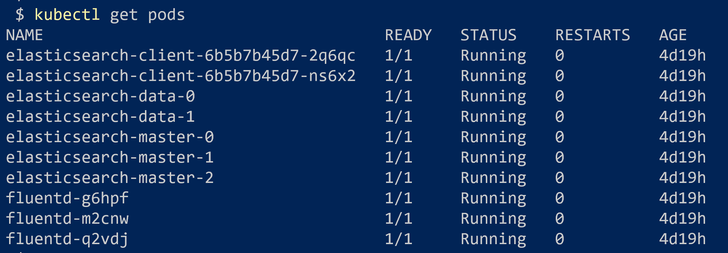
Let’s wait for a few (10-15) minutes to create all the required components. After that, we can check the created pods using the command:
Then we can check for the created services with the command:
2. Installing Fluentd as DaemonSet
Fluentd should be installed on each node on the Kubernetes cluster. To achieve that, we use the DaemonSet. Fluentd development team provided a simple configuration file available here: https://github.com/fluent/fluentd-kubernetes-daemonset/blob/master/fluentd-daemonset-elasticsearch.yaml
Fluentd should be able to send the logs to Elasticsearch. It needs to know its service name, port number and the schema. These configurations will be passed to the Fluentd pods through environment variables. Thus, in the yaml file, we notice the following configurations:
The value "elasticsearch-client" is the name of the Elasticsearch service that routes traffic into the client pod.
Note: A DaemonSet is a Kubernetes object used to deploy a Pod on each Node.
Note: Fluentd could be deployed also using a Helm chart available on this link https://github.com/helm/charts/tree/master/stable/fluentd.
Now let’s deploy Fluentd using the command:
We can verify the install by checking the 3 new pods, 3 because we have 3 nodes in the cluster:
3. Installing Kibana using Helm
The last component to install in EFK is Kibana. Kibana is available as a Helm chart that could be found here: https://github.com/helm/charts/tree/master/stable/kibana.
The chart will deploy a single Pod, a Service and a ConfigMap. The ConfigMap get its key values from the values.yaml file. This config will be loaded by the Kibana container running inside the Pod. This configuration is specific to Kibana, to get the Elasticsearch host or service name, for example. The default value for the Elasticsearch host is http://elasticsearch:9200. While in our example it should be http://elasticsearch-client:9200. We need to change that.
The Service that will route traffic to Kibana Pod is using type ClusterIP by default. As we want to access the dashboard easily, we’ll override the type to use LoadBalancer. That will create a public IP address.
In Helm, we can override some of the config in values.yaml using another yaml file. We’ll call it kibana-values.yaml. Lets create that file with the following content:
Now, we are ready to deploy Kibana using Helm with the overridden configuration:
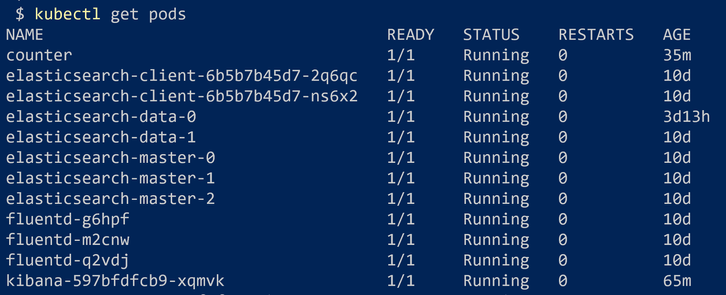
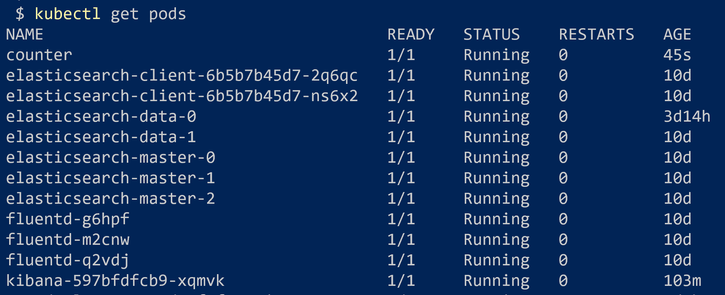
In a few seconds, when the deployment is complete, we can check whether the created Pod is running using kubectl get pods command.
Then we check for the created service with LoadBalancer type.
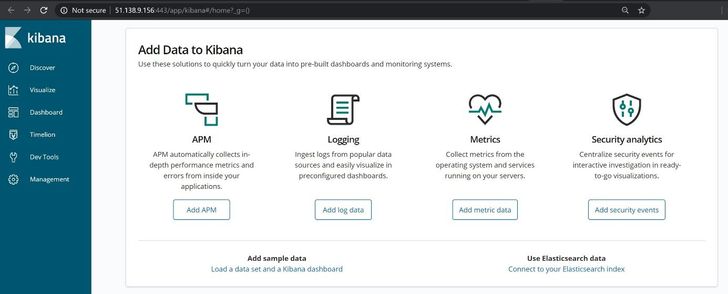
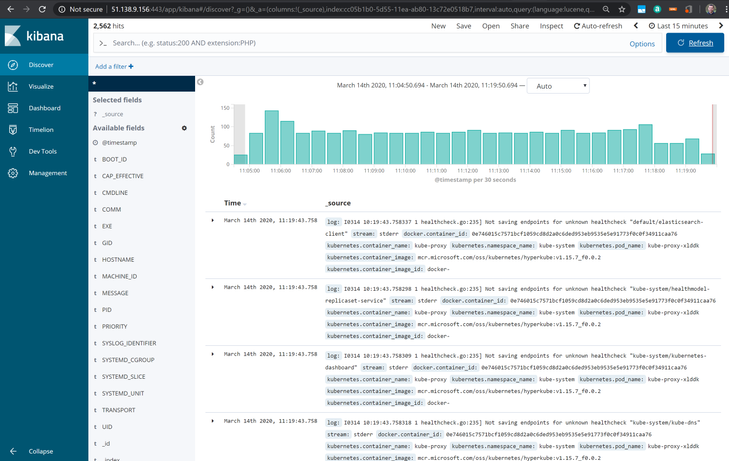
From here, we can copy the external IP address (51.138.9.156 here) and open it in a web browser. We should not forget to add the port number which is 443.
Then click on “Discover”. And there we’ll find some logs !
4. Deploying and viewing application logs
In this section, we’ll deploy a sample container that outputs log files in an infinite loop. Then we’ll try to filter these logs in Kibana.
Let’s first deploy this sample Pod:
We make sure it is created successfully:
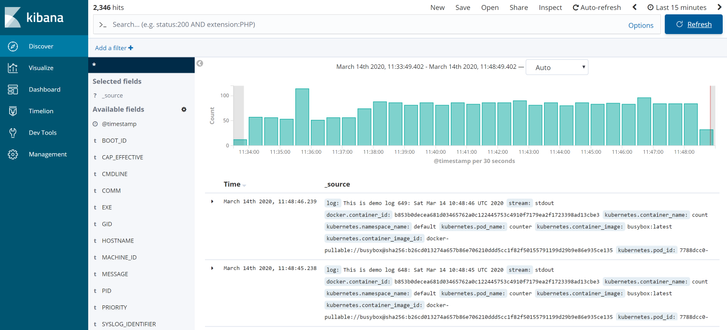
Now, if we switch to Kibana dashboard and refresh it, we’ll be able to see logs collected from the counter Pod:
We can also filter the logs using queries like: kubernetes.pod_name: counter.
The content of this article is also available as a video on youtube on this link: https://www.youtube.com/watch?v=9dfNMIZjbWg&list=PLpbcUe4chE79sB7Jg7B4z3HytqUUEwcNE&index=5
Conclusion
It was easy to get started with EFK stack on Kubernetes. From here we can create custom dashboards with nice graphs to be used by the developers.
Additional notes
Note: We installed the ELK stack in the default namespace for simplicity. But it is recommended to install it on either kube-system or a dedicated namespace.
Note: Elasticsearch have its own repo built to support v7, it is still in preview today https://github.com/elastic/helm-charts/tree/master/elasticsearch
Disclaimer
The sample scripts are not supported under any Microsoft standard support program or service. The sample scripts are provided AS IS without warranty of any kind. Microsoft further disclaims all implied warranties including, without limitation, any implied warranties of merchantability or of fitness for a particular purpose. The entire risk arising out of the use or performance of the sample scripts and documentation remains with you. In no event shall Microsoft, its authors, or anyone else involved in the creation, production, or delivery of the scripts be liable for any damages whatsoever (including, without limitation, damages for loss of business profits, business interruption, loss of business information, or other pecuniary loss) arising out of the use of or inability to use the sample scripts or documentation, even if Microsoft has been advised of the possibility of such damages.

