This post has been republished via RSS; it originally appeared at: Configuration Manager Blog articles.
With the current transition to remote working, most of our IT professionals have sought guidance on managing and securing devices while away from the corporate network. Many Configuration Manager administrators have followed our recommended guidance and shifted, or are in the process of shifting, device and endpoint management from on-premises to the internet by leveraging the cloud management gateway (CMG) scenario. If you already done so, follow this blog post for guidance on CMG deployment and the prescriptive guidance in this blog post for patching devices off the corporate network. For more information, see the Plan for the cloud management gateway article in the Configuration Manager documentation.
Our customers have also been asking us for guidance about troubleshooting and supporting these devices since common built-in tools such as the Computer Management console, PowerShell remoting, and WBEMTEST aren’t viable in these scenarios. This blog post shows examples of CMPivot queries for gathering troubleshooting data. These queries can gather real-time results for clients that are communicating with your new cloud management gateway.
What is CMPivot?
CMPivot is an in-console utility introduced in Configuration Manager version 1806 that provides access to the real-time state of devices in your environment. It immediately runs a query on all currently connected devices in the target collection and returns the results. You can then filter and group this data from within the tool. By providing real-time data from online clients, you can quickly answer business questions, troubleshoot issues, and respond to security incidents.
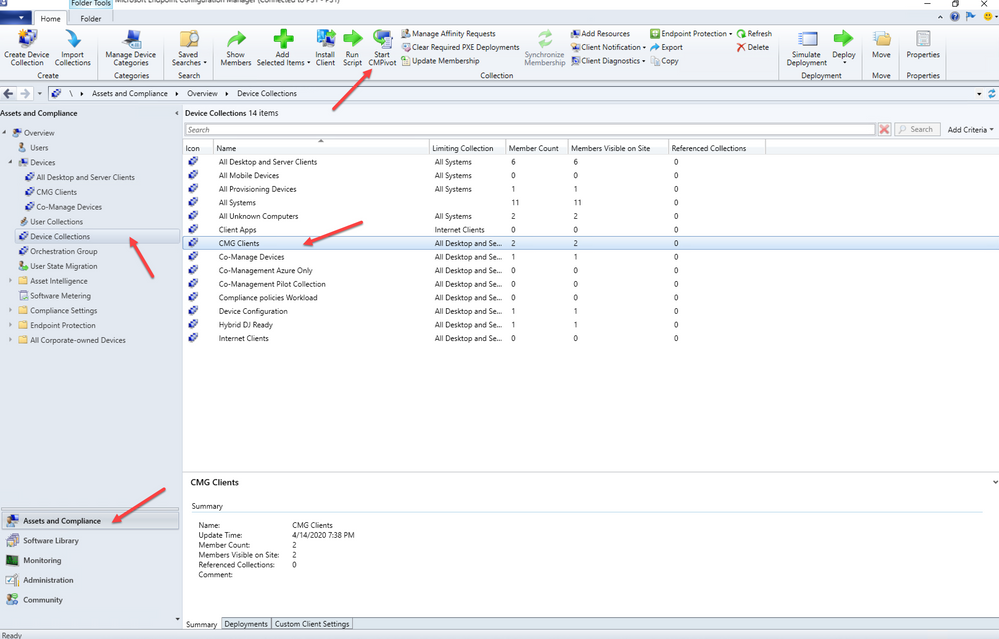
To use CMPivot, open the Configuration Manager console and navigate to the Assets and Compliance workspace. Expand the Device Collections node and select a collection that contains your CMG Clients. Click Start CMPivot in the ribbon to launch the tool. In the example below, a collection has been created called CMG Clients which contains devices that are communicating with the CMG.
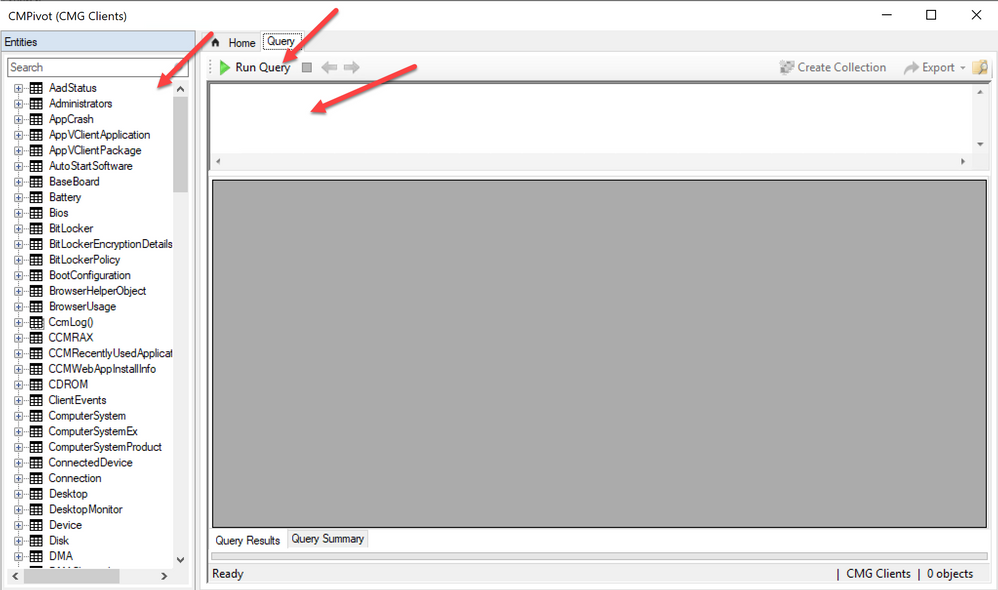
Once CMPivot launches, you have the ability to perform a series of queries on your clients to get the current status and health, including clients connecting through your CMG.
Querying clients with CMPivot
Below are some commonly used queries that can help keep track of your remotely connected clients. For each of the examples, copy the query and paste it into CMPivot. Once the query is in CMPivot, click Run Query.
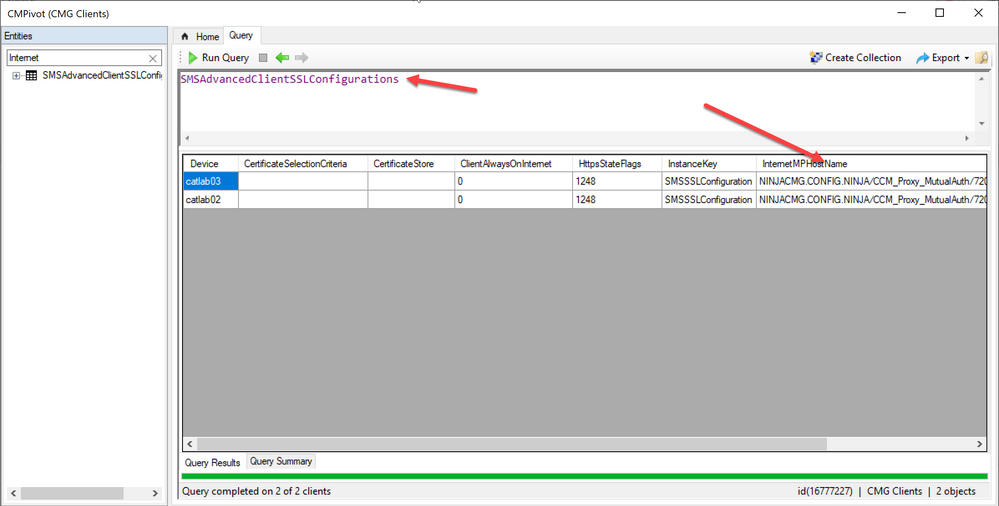
Example 1: Review the management point configuration from cloud managed clients.
The first example shows which management points the clients are configured to use.
Example 2: Review client services.
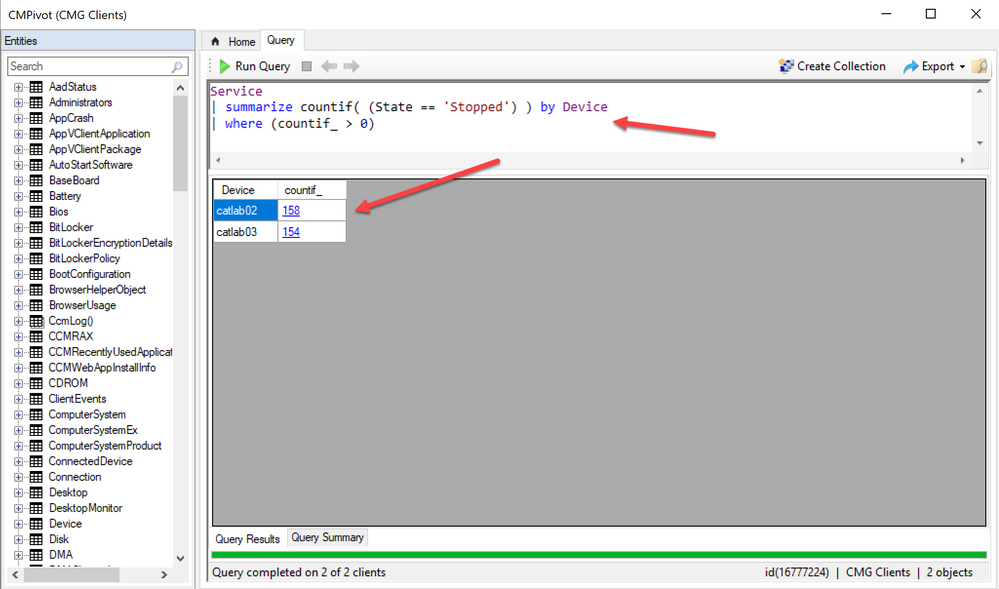
The second example shows how to view a count of services that are currently stopped for each device in the collection.
As you can see in this example it has returned the number of services that are currently stopped on the "CMG clients" collection. Let’s continue to enhance the query and add some more criteria to it.
Example 3: Reviewing the state of services from a specific device.
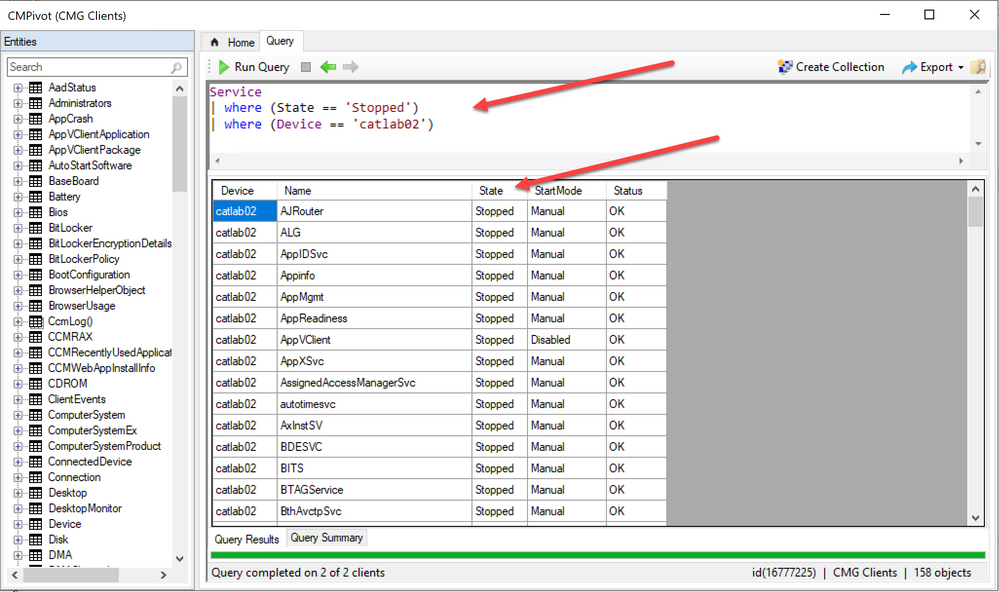
The third example shows the state of the various services on a specific device.
As you can see the results display services that are stopped from the catlab02 Windows 10 client which is currently communicating with the cloud management gateway.
Example 4: Enhance the query with additional criteria.
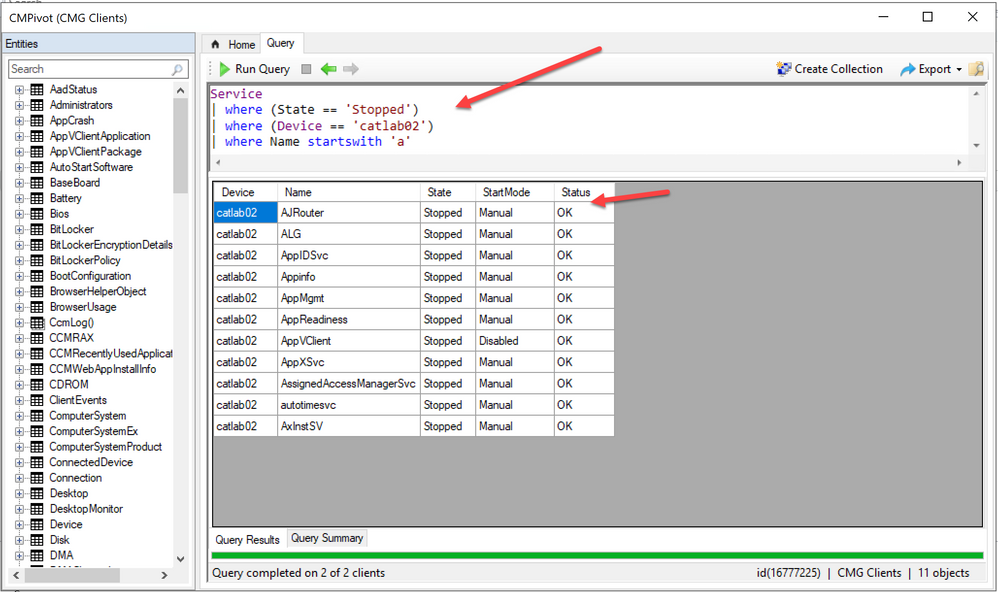
In the fourth example, we enhance the query by narrowing it down to services starting with the letter A.
As you can see now, the services that start with letter "A" are displayed from the catlab02 Windows 10 client.
Example 5: Recently used apps with chart rendering
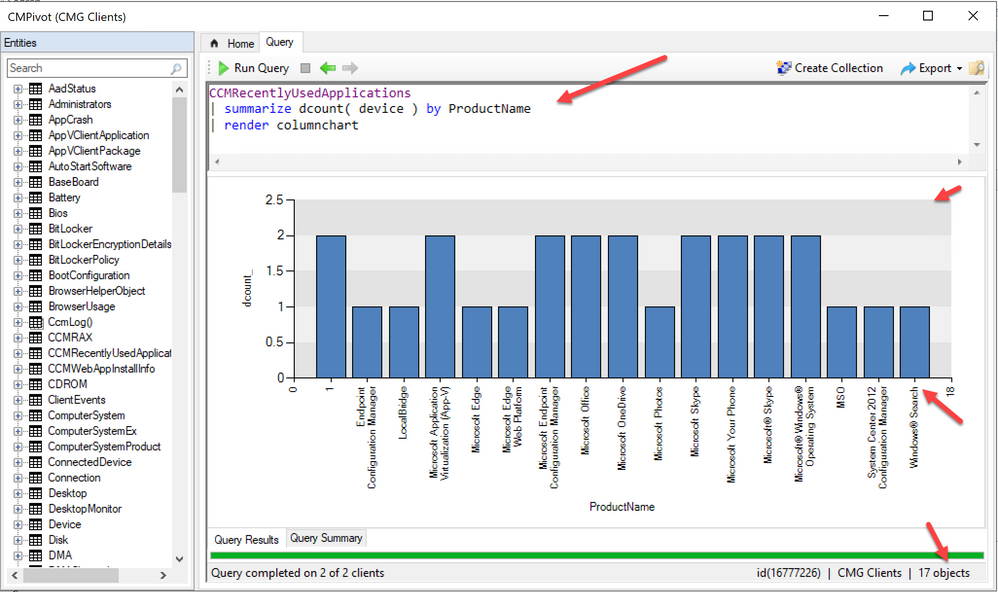
Here is an example of a query that can be used one these clients to inventory recently used apps.
The following results display the recently used app inventory. The light blue is stored data and the dark blue is the real-time data. This allows you to see the data quickly and also see data for devices that might currently be off-line. You can use operators, such as Top (10) and Render too. CMPivot uses a subset of the Kusto query language which is documented .
Example 6: Query application crashes
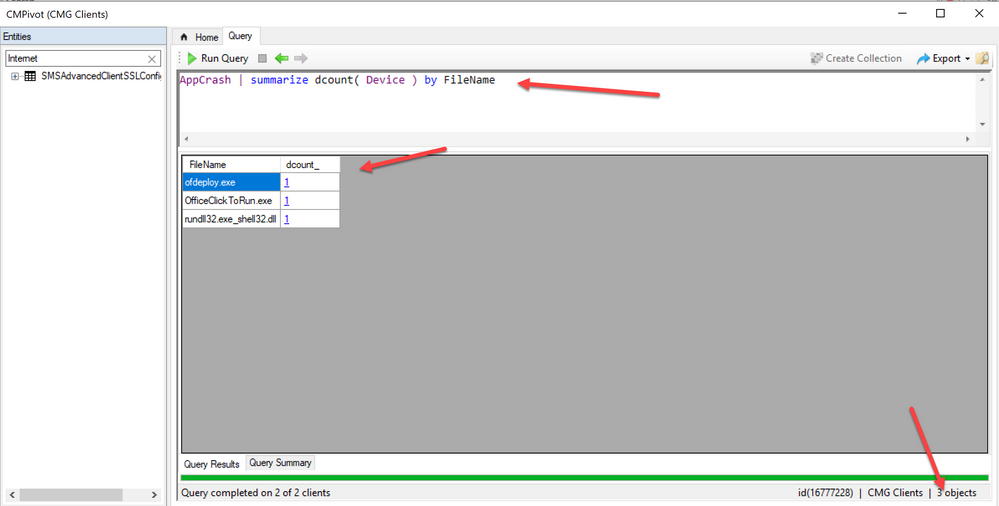
The following returns a list of application crashes from our example CMG collection.
As you can see from the example results, CMPivot returns applications that are crashing and the number devices with the crash.
Example 7: Missing software updates
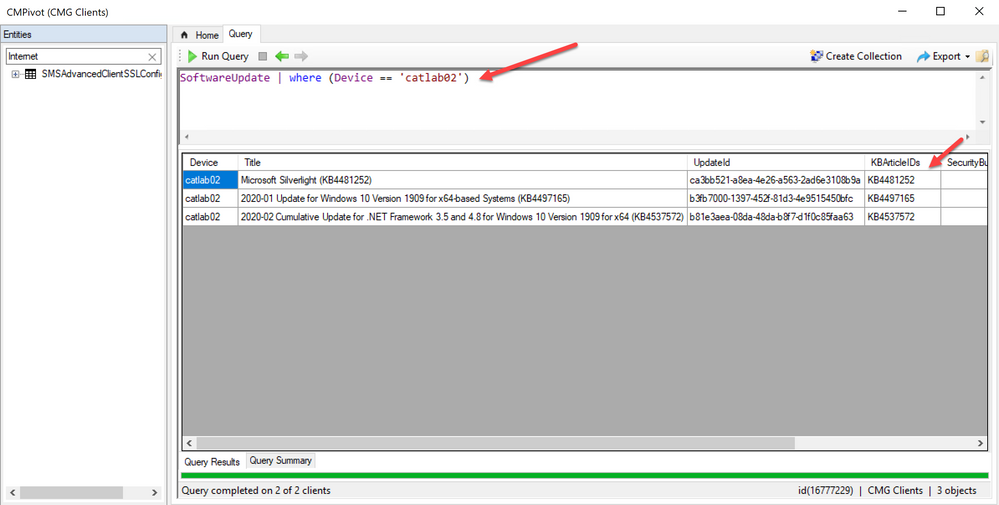
In this next example we will review the current list of updates that are applicable but not installed on the specific device.
In this example updates missing from the device are displayed.
Example 8: File inventory and summarization
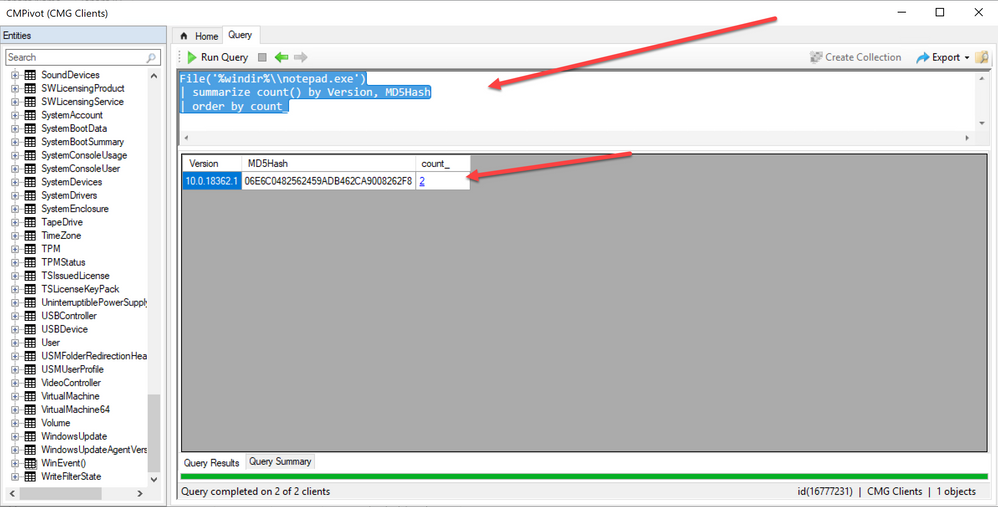
This next example summarizes a file from the devices in the collection
In this example the query filters the results and presents us with a count of Notepad.exe from all the devices.
Example 9: Render data into a bar chart
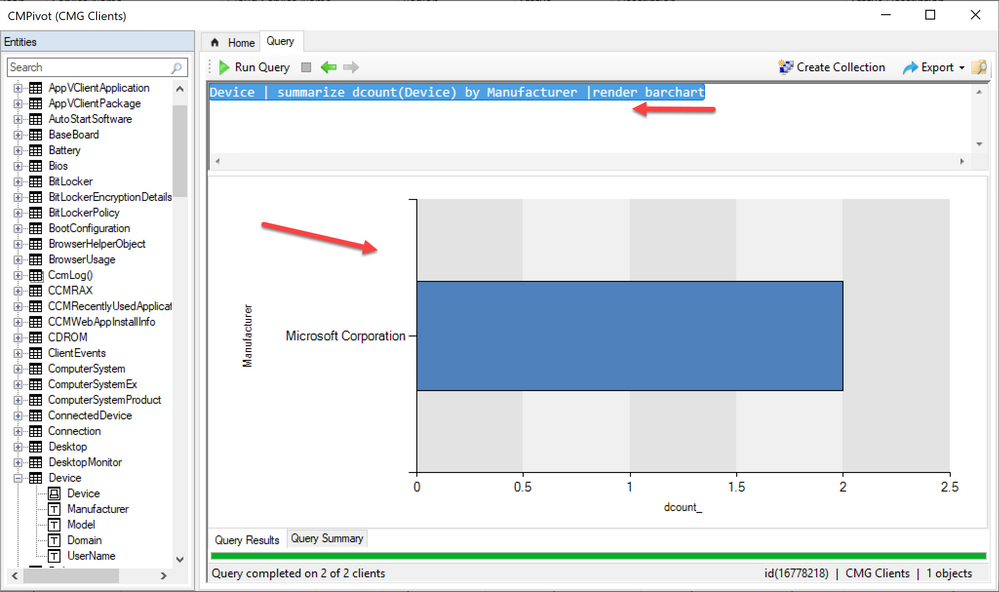
In this example we will render one of the queries into a bar chart.
Once the data gets rendered, it’s easier to evaluate the data by visualizing it.
Example 10: Render data into a pie chart
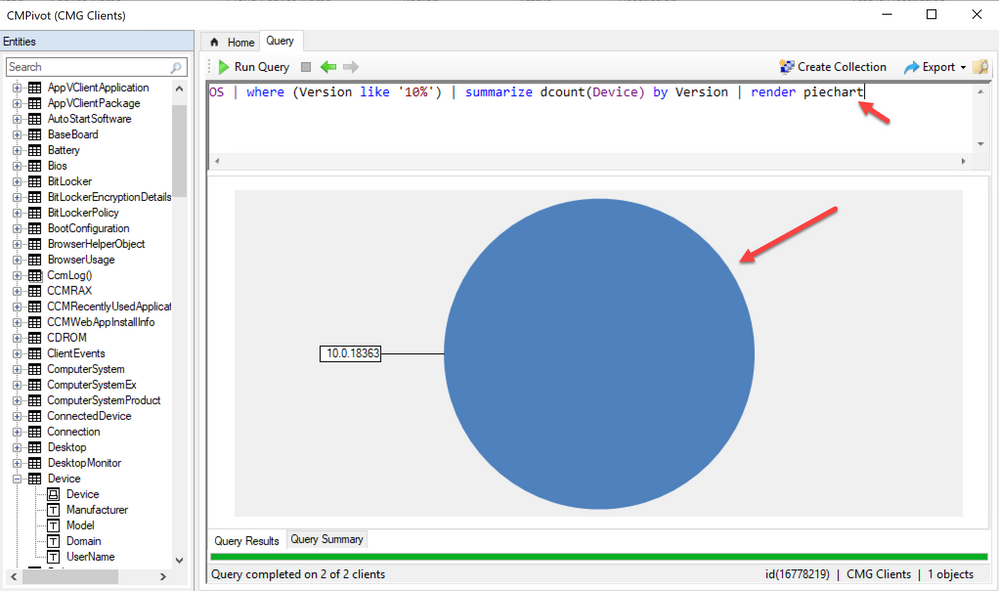
In this example we will render out a query to a pie chart.
If you’d like to understand more about rendering, check out the following infographic in the TechNet Gallery.
Summary
CMPivot can be leveraged as a very powerful tool for immediate troubleshooting of clients. When combined with a cloud management gateway, CMPivot has great potential for use in work-from-home scenarios for corporate devices. The examples provided in this post help you get started with the most common queries. It’s important to note that queries might be delayed during a query as the data travels from the CMG to Configuration Manager. You might notice a small delay in comparison to a traditional query performed on the internal corporate network.
You are also welcome to share any helpful queries you might be using for troubleshooting in the comments below.
Special thanks to

