
This post has been republished via RSS; it originally appeared at: Microsoft Research.
As the COVID-19 pandemic continues to impact communities around the world, researchers everywhere are fighting hard in the hopes of gradually understanding the mystery of the COVID-19 virus through the most advanced technologies available. Based on their expertise and research experience in the fields of computational biology and data analytics, researchers from Microsoft Research Asia built the COVID Insights website. This website is intended to be a resource for those interested in analyzing data related to the pandemic.
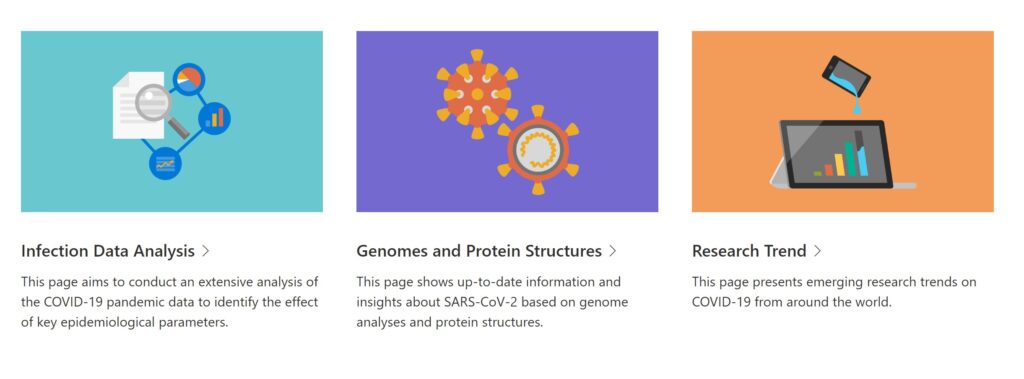
The COVID Insights website mainly consists of three major sections: Infection Data Analysis, Genomes and Protein Structures, and Research Trends. It visually and interactively displays the pandemic trends in different countries and regions; the virologic analysis of the virus that causes the disease, SARS-CoV-2; and the latest global research focuses. All data used on the website is taken from publicly available sources, including from Johns Hopkins University, the U.S. Centers for Disease Control and Prevention and the Global Initiative on Sharing All Influenza Data (GISAID), among others. Leveraging the public data, Microsoft researchers use advanced technology to discover patterns and insights to further expand thinking on the pandemic.
Which two regions share the most similar pandemic trends?
The “Infection Data Analysis” page presents cross-country/region comparisons of transmission dynamics. For example, through analysis, researchers found that the data trend in Germany from February 27 to March 14 closely resembled the data trend in South Korea from February 18 to March 5, and so the containment measures taken in South Korea after March 5 can serve as a more accurate reference for Germany in mid-March.

Here, researchers represented the COVID-19 time-series data in a low-dimensional Euclidean space. For a specific region and time interval, researchers used a vector in this space to reflect data trend, which allows them to discover similarities in pandemic trends between certain countries or regions at certain time periods, thereby finding a suitable object of reference.
In addition, based on open-source data from four different regions, the page provides a unified view of data analysis on high-risk activities associated with COVID-19, making it easy to compare transmission data differences among regions. For example, crowd gathering is the most distributed high-risk activity in France, while “International Travel” is the leading high-risk activity in Singapore.

Because of large differences in data from different regions, effective information may be displayed at different granularities or may be buried in lengthy case descriptions. Researchers map unstructured case descriptions to the unified activity distribution for visualization, which effectively solves this challenge. Attribution analysis of high-risk activities, especially different attribution results from different regions, can help provide a personalized reference for infection prevention.
In which regions of the world has SARS-CoV-2 experienced mutations?
The “Genomes and Protein Structures” page presents the latest virologic analysis on SARS-CoV-2. Up until now, the novel coronavirus has evolved many genetic variants. Here, visitors to the website can interactively explore the amino acid mutations and their positions in the genome sequence, the geographic location of the mutations, and the corresponding protein structure.

SARS-CoV-2 genomes were downloaded from GISAID for mutation analysis. The isolate Wuhan-Hu-1 (GenBank accession NO. MN908947.3) was selected as the reference, and the amino acid mutations were identified within the coding regions for each genome sequence. For each mutation site, the amino acids’ diversity (entropy) and the distribution across countries and over time are displayed.
Researchers also translated the nucleotide sequences of the SARS-CoV-2 virus into protein sequences and split them into pieces, finally presenting the three-dimensional structure of the protein. In addition, visitors can view a comparative analysis of the genomes of SARS-CoV-2 and four other coronaviruses, including SARS and MERS, to understand the similarities and differences between them.

What are the latest research trends related to the pandemic and the virus?
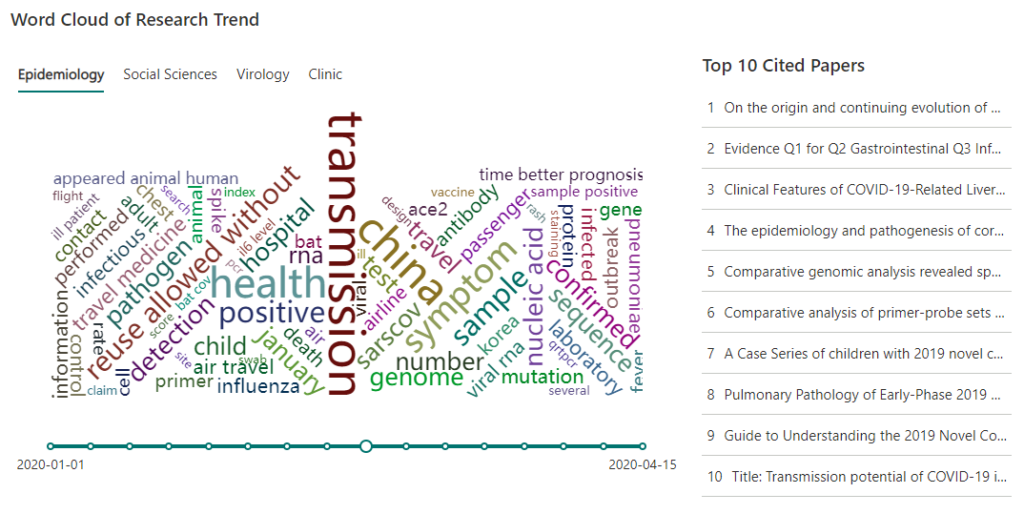
On the “Research Trends” page, visitors can learn about the most cited papers and changing research trends related to the novel coronavirus through data visualization. Researchers use automatic clustering technologies to summarize keywords and build a word cloud, showing changes in time granularity through weekly updates, which they hope will bring further inspiration to other researchers.
The researchers behind the website hope that COVID Insights can help visitors understand the pandemic in a scientific way, through in-depth analysis and the mining of insights from pandemic data. In the future, we will share more insights on the novel coronavirus data through this website to provide continuous support in fighting the outbreak. At the same time, we hope that more AI researchers, data scientists, and computational biologists will continue to work together to jointly accelerate the progress of scientific research and overcome the pandemic as soon as possible.
The post Researchers in Microsoft Research Asia lab launch COVID Insights website appeared first on Microsoft Research.