This post has been republished via RSS; it originally appeared at: New blog articles in Microsoft Tech Community.
Here is Helder Pinto PFE presenting the first post of a series dedicated to the implementation of automated Continuous Optimization with Azure Advisor Cost recommendations.
Introduction
We can define Continuous Optimization (CO) in the context of Microsoft Azure and IT environments in general as an iterative process aiming at constantly assessing optimization opportunities in our infrastructure and implement required changes. This is done routinely in many organizations – finding and implementing performance, security, or cost optimization opportunities can be a full-time job in some large enterprise scenarios.
Azure Advisor is a great, free governance tool that every Azure customer should look at often and use as a source of CO. In Azure Advisor, you can find recommendations for several categories: Performance, High Availability, Security (sourced from Azure Security Center), Operational Excellence, and Cost (coming from Azure Cost Management). Each recommendation comes with a justification, impact level and details on how to optimize the impacted resources. See more details here.
The problem
All Advisor recommendations are actionable and, in many cases, automatable – ultimately, CO should be as automatic as CI/CD. For example, when Advisor finds Virtual Machines missing endpoint protection, we can automate the deployment of the corresponding VM extension.
When it comes to Cost recommendations, there are also some scenarios where optimization automation is easy to implement: deleting orphaned Public IPs or moving snapshots to Standard Storage are some examples. However, when customers look at Virtual Machine right-size recommendations – one of the recommendations with higher cost optimization impact –, very few feel comfortable enough to act accordingly, even more if asked to automate the action, as Advisor lacks some important details. These are some questions many customers ask:
- “What was the rationale behind this recommendation? Which actual metrics and thresholds were considered to make the decision?”
- “How confident can I be to execute the recommended downsize and not have a performance issue afterwards?”
- “How can I be sure the recommended size can cope with the current amount of data disks or network interfaces?”
As of today, the documentation about Cost recommendations states that Advisor “considers virtual machines for shut-down when P95th of the max of max value of CPU utilization is less than 3% and network utilization is less than 2% over a 7 day period. Virtual machines are considered for right size when it is possible to fit the current load in a smaller SKU (within the same SKU family) or a smaller number # of instance such that the current load doesn’t go over 80% utilization when non-user facing workloads and not above 40% when user-facing workload.”
We have an idea of how the recommendation was generated, but customers need more details, such as the actual Azure Monitor metrics that supported the recommendation and projections of the smaller SKU against the current capacity requirements. The algorithm itself is not clearly documented, e.g., what “P95th of the max of max” or “current load” mean? And it is not considering storage I/O metrics nor disk or NIC count properties.
Reviewing and validating recommendations one-by-one requires thus a lot of effort, the more for large-scale customers with hundreds of right-size recommendations. Ideally, any detail accompanying a recommendation should be provided in a machine-understandable manner, so that automated actions can be implemented on top.
For the reasons above, some customers I work with have asked guidance on how to get higher confidence on cost recommendations so that they can automate remediation or, at least, filter out recommendations that haven’t a strong enough ground to be further investigated. This post gives an overview of a possible solution for this requirement and the remaining articles in the series will provide you with the actual technical details of the solution.
A solution architecture
Getting higher confidence on Advisor Cost right-size recommendations and enabling remediation automation means:
- Augmenting Advisor recommendations with Virtual Machine performance metrics and properties:
- Processor (including per core), memory, disk (IOPS and throughput), and network usage metrics
- OS Type
- Current SKU memory
- Data disk and network interface count
- Calculating a confidence score based on customer-defined performance thresholds and platform-defined target SKU limits:
- Customer-provided CPU, memory, or disk usage thresholds
- Azure platform VM SKU limits (max. data disk count, max. NIC count, max. IOPS, etc.)
- Providing augmented recommendations both in human- and machine-accessible ways:
- Visualize latest recommendations in a dashboard
- Provide historical perspective, i.e., for how long a recommendation has been done
- Access via query API or CSV exports
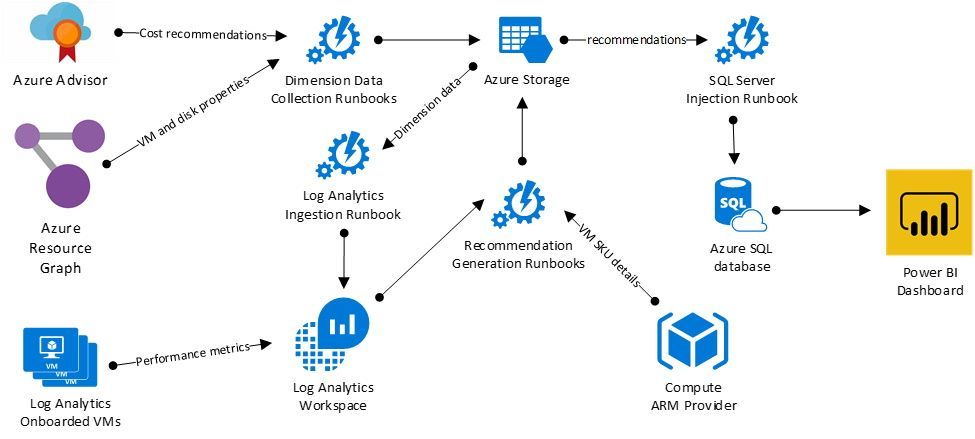
These requirements imply the usage of multiple sources of information beyond Azure Advisor itself. The architecture depicted below summarizes the tools and services that can possibly be used to build such a solution. The solution architecture is a typical ETL and analytics pattern implemented on top of Azure Automation and Log Analytics.
Dimension Data Collection Runbooks periodically collect data from Azure Advisor (Cost recommendations) and Azure Resource Graph (Virtual Machine and Managed Disk properties) and dump to an Azure Storage Account container a selection of properties as CSV raw data . The Azure Storage Account repository has a long-term retention and can be used as well as a source for replaying transformation and load operations. We are using here only a couple of data sources, but others could easily be plugged in (Azure Billing, Azure Monitor metrics, etc.).
Raw data files are ingested into the Log Analytics workspace by the Log Analytics Ingestion Runbook, where Virtual Machines also send performance metrics thanks to the Log Analytics agents. With all the data together in the same repository and with the power of Log Analytics, it is possible to augment Azure Advisor recommendations with very useful information and even generate new recommendation types out of Azure Resource Graph and performance counters .
Recommendation Generation Runbooks have recommendation type-specific logic that queries the Log Analytics workspace as well as other sources of information (e.g., the Compute ARM provider) to augment or generate a recommendation. In this scenario, Advisor Cost recommendations are merged with VM properties and performance metrics aggregates. Other scenarios could easily arise from the available data, such as recommendations for deleting orphaned disks. Again, all these runbooks dump the augmented recommendations to an Azure Storage Account container.
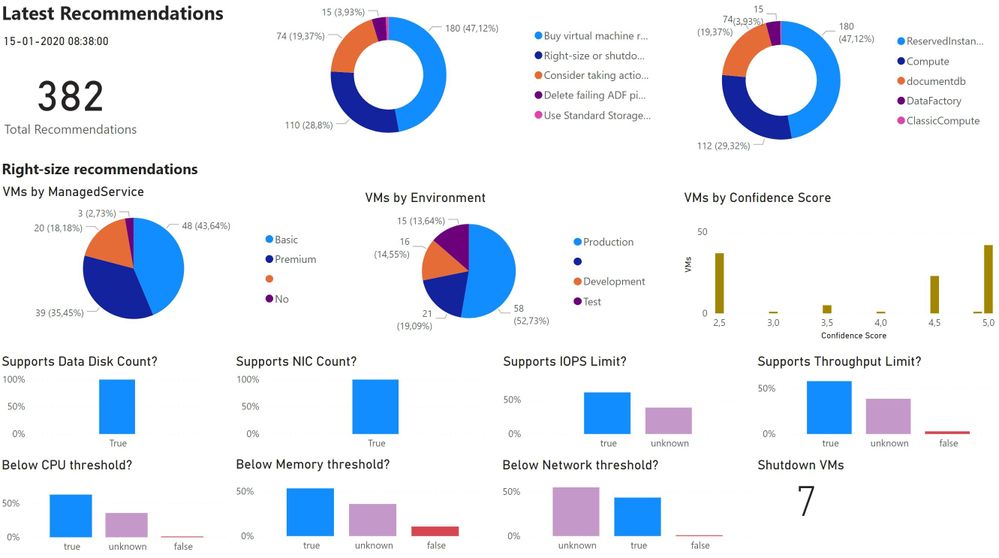
Finally, the SQL Server Injection Runbook periodically parses the raw recommendation files and sends them as new rows to an Azure SQL database containing all the recommendations history. The result of the process is visible in a Power BI dashboard – see sample view below.
A little note on some architectural decisions. First, the Power BI report could connect directly to the Azure Storage Account instead of using an intermediary SQL Database. However, using a SQL interface enables better querying and data transformation capabilities and makes integration with third-party reporting solutions easier. Secondly, one can argue that, when trying to save on Azure costs, we are adding other costs (Automation, Storage Account, SQL Database and Log Analytics). The fact is that almost all components are very cheap and the amount of ingested data in Log Analytics for VM metrics can be optimized to collect only the required counters with a large collection interval. Moreover, if an organization was already using Log Analytics for VM metrics, we are just leveraging this data with no additional costs.
In the upcoming posts in this series, we will look at the implementation details of each step of the process and understand how this solution can be used to automate right-size remediations with high confidence. Stay tuned!


