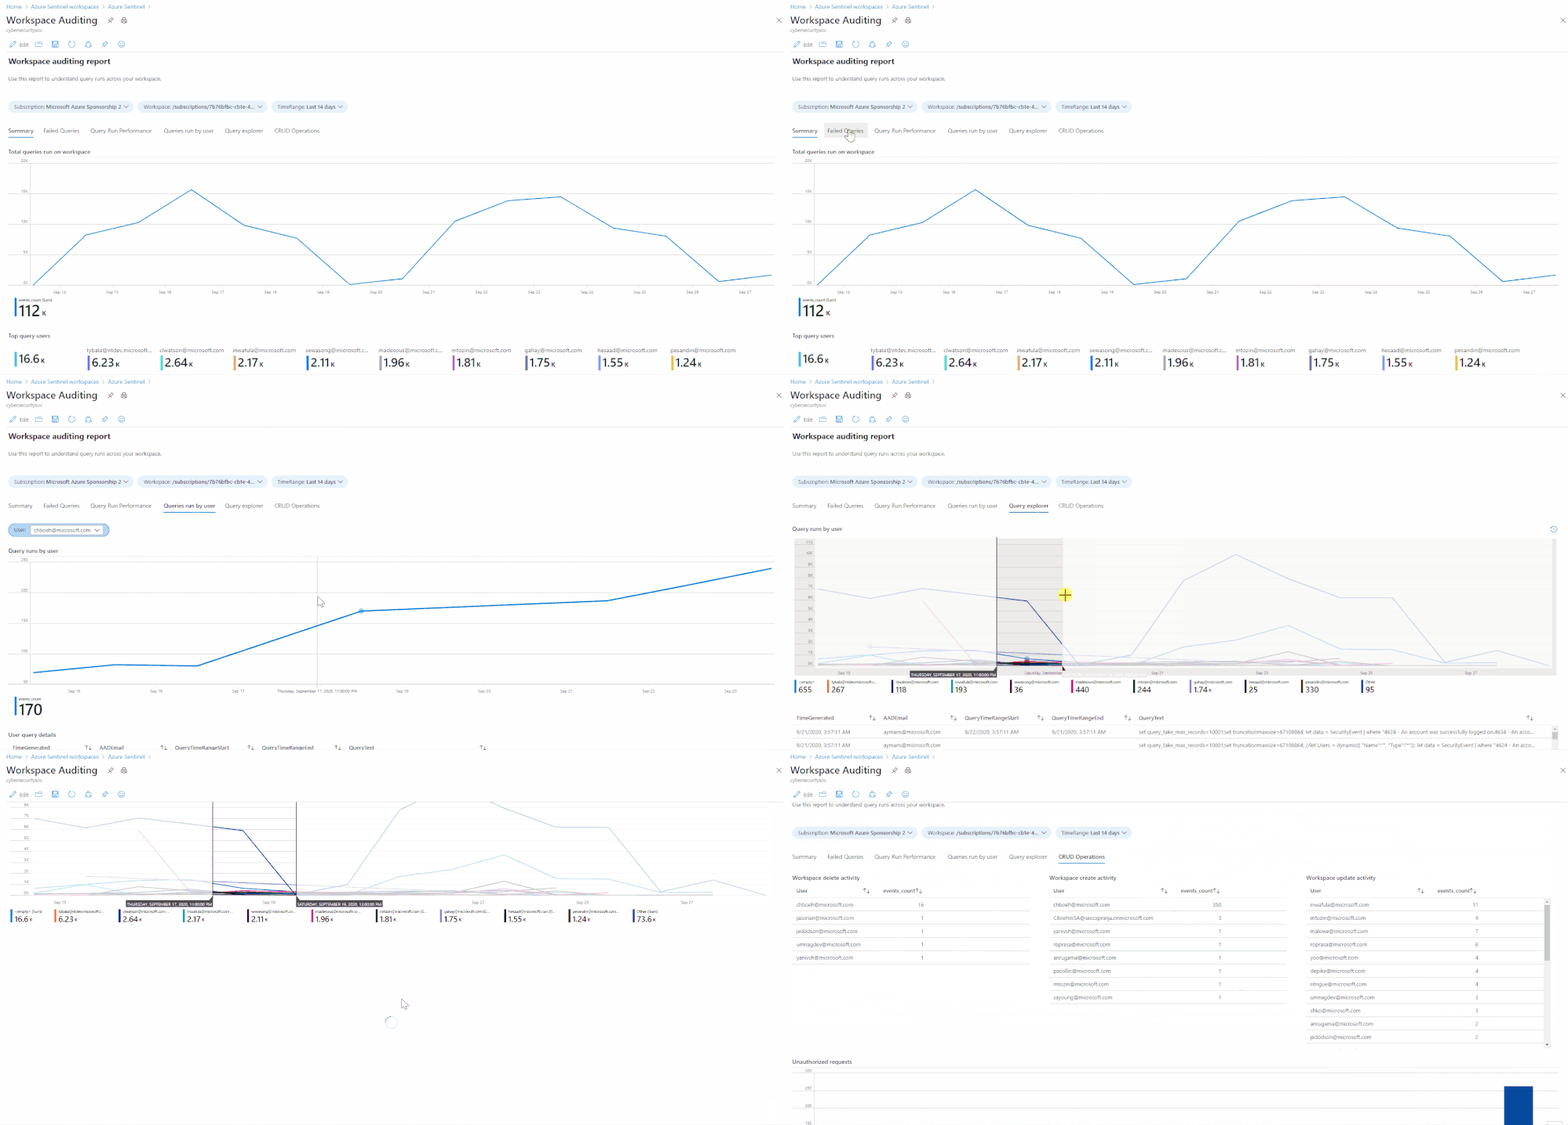
Many customers require the ability to audit what happens in their SOC environment for both internal and external compliance requirements . It is important to understand the who/what/when’s of activities within your Azure Sentinel instance. In this blog, we will explore how you can audit your organization’s SOC if you are using Azure Sentinel and how to get the visibility you need with regard to what activities are being performed within your Sentinel environment. The accompanying Workbook to this blog can be found here.
There are two tables we can use for auditing Sentinel activities:
- LAQueryLogs
- Azure Activity
In the following sections we will show you how to set up these tables and provide examples of the types of queries that you could run with this audit data.
LAQueryLogs table
The LAQueryLogs table containing log query audit logs provides telemetry about log queries run in Log Analytics, the underlying query engine of Sentinel. This includes information such as when a query was run, who ran it, what tool was used, the query text, and performance statistics describing the query’s execution.
Since this table isn’t enabled by default in your Log Analytics workspace you need to enable this in the Diagnostics settings of your workspace. Click here for more information on how to do this if you’re unfamiliar with the process.
A full list of the audit data contained within these columns can be found here. Here are a few examples of the queries you could run on this table:
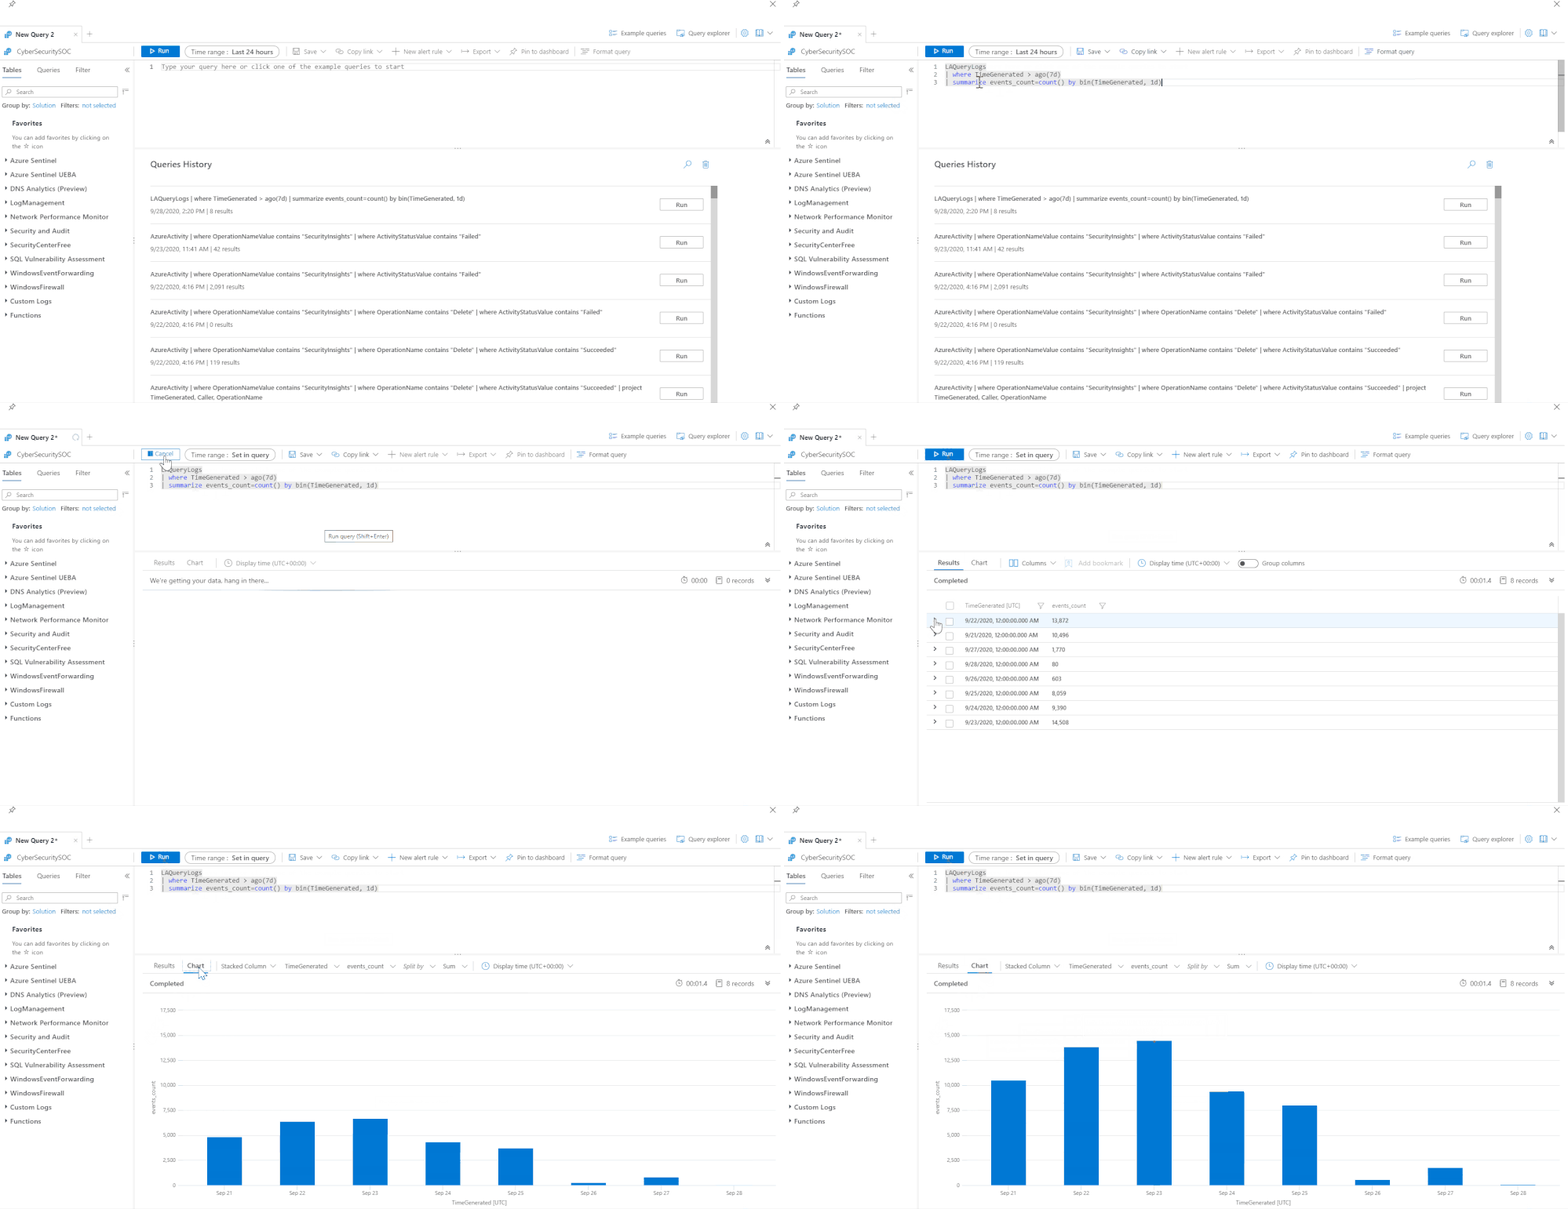
How many queries have run in the last week, on a per day basis:
| where TimeGenerated > ago(7d)
| summarize events_count=count() by bin(TimeGenerated, 1d)
Number of queries where anything other than HTTP response request 200 OK is received (i.e. the query failed):
| where ResponseCode != 200
| count
Show which users ran the most CPU intensive queries based on CPU used and length of query time:
|summarize arg_max(StatsCPUTimeMs, *) by AADClientId
| extend User = AADEmail, QueryRunTime = StatsCPUTimeMs
| project User, QueryRunTime, QueryText
| order by QueryRunTime desc
Summarize who ran the most queries in the past week:
| where TimeGenerated > ago(7d)
| summarize events_count=count() by AADEmail
| extend UserPrincipalName = AADEmail, Queries = events_count
| join kind= leftouter (
SigninLogs)
on UserPrincipalName
| project UserDisplayName, UserPrincipalName, Queries
| summarize arg_max(Queries, *) by UserPrincipalName
| sort by Queries desc
AzureActivity table
As in other parts of Azure, you can use the AzureActivity table in log analytics to query actions taken on your Sentinel workspace. To list all the Sentinel related Azure Activity logs in the last 24 hours, simply use this query:
| where OperationNameValue contains “SecurityInsights”
| where TimeGenerated > ago(1d)
This will list all Sentinel-specific activities within the time frame. However, this is far too broad to use in a meaningful way so we can start to narrow this down some more. The next query will narrow this down to all the actions taken by a specific user in AD in the last 24 hours (remember, all users who have access to Azure Sentinel will have an Azure AD account):
| where OperationNameValue contains “SecurityInsights”
| where Caller == “[AzureAD username]”
| where TimeGenerated > ago(1d)
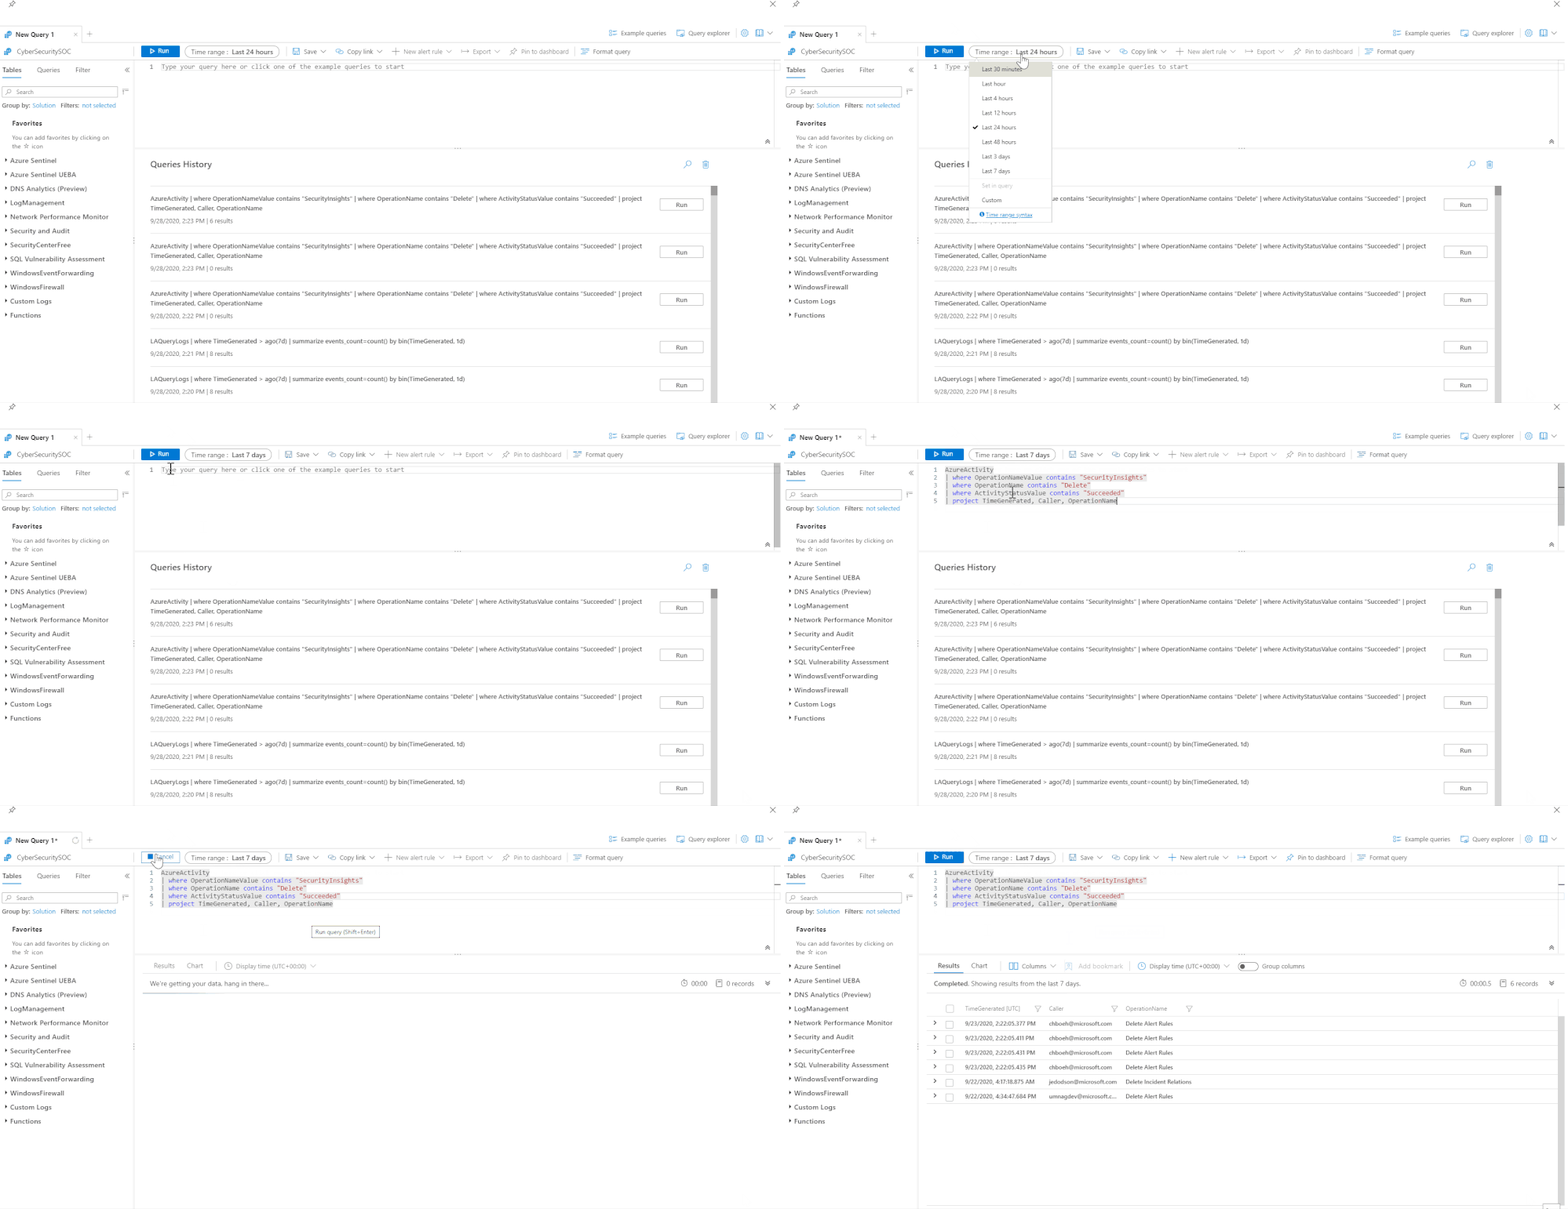
Final example query – this query shows all the delete operations in your Sentinel workspace:
| where OperationNameValue contains “SecurityInsights”
| where OperationName contains “Delete”
| where ActivityStatusValue contains “Succeeded”
| project TimeGenerated, Caller, OperationName
You can mix these up and add even more parameters to search the AzureActivities log to explore these logs even more, depending on what your organization needs to report on. Below is a selection of some of the actions you can search for in this table:
- Update Incidents/Alert Rules/Incident Comments/Cases/Data Connectors/Threat Intelligence/Bookmarks
- Create Case Comments/Incident Comments/Watchlists/Alert Rules
- Delete Bookmarks/Alert Rules/Threat Intelligence/Data Connectors/Incidents/Settings/Watchlists
- Check user authorization and license
Alerting on Sentinel activities
You may want to take this one step further and use Sentinel audit logs for proactive alerts in your environment. For example, if you have sensitive tables in your workspace that should not typically be queried, you could set up a detection to alert you to this:
| where QueryText contains “[Name of sensitive table]”
| where TimeGenerated > ago(1d)
| extend User = AADEmail, Query = QueryText
| project User, Query
Sentinel audit activities Workbook
We have created a Workbook to assist you in monitoring activities in Sentinel. Please check it out here and if you have any improvements or have made your own version you’d like to share, please submit a PR to our GitHub repo!
With thanks to


