Lesson Learned #148: High wait time due to Parameter Sniffing

This post has been republished via RSS; it originally appeared at: Azure Database Support Blog articles.

This last week I had a service request where our customer faced a high wait time due to a parameter sniffing. In this situation, our customer is not able to change any option of the query and they asked about if there is any other option to fix this issue.


We have several alternatives but I would like to share 3 of them besides other ones:

Alternative 1

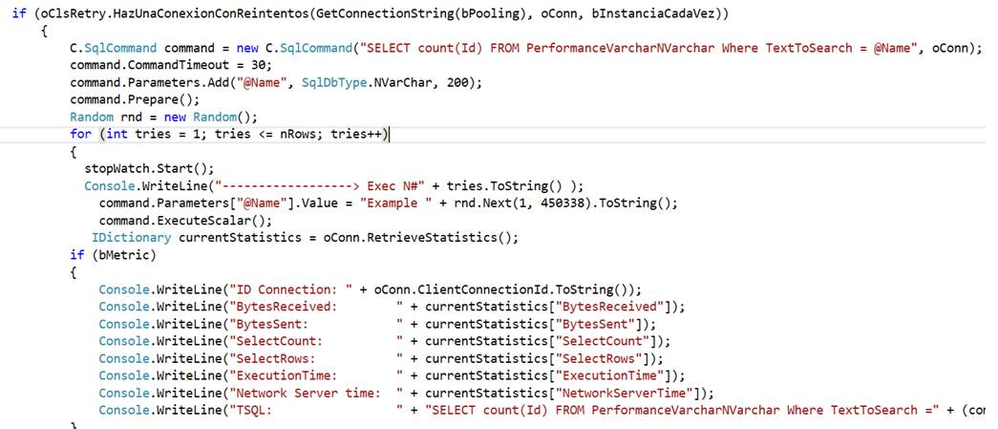
  • I developed an application that is running a parametrized query like our customer has.

Code1.png


  • As you could see we have a process that creates a cached plan.


SELECT plan_handle,UseCounts,RefCounts, Cacheobjtype, Objtype, TEXT AS SQL FROM sys.dm_exec_cached_plans CROSS APPLY sys.dm_exec_sql_text(plan_handle) where text like '%SELECT count(Id) FROM PerformanceVarcharNVarchar%' AND objtype='Prepared'


code2.png


Alternative 2


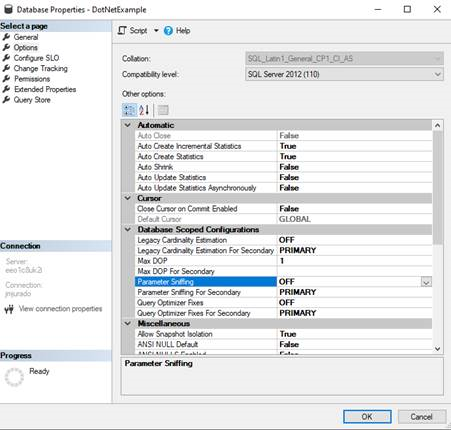
  • Other option that you have is to disable parameter sniffing in the database properties. But, you could have other performance issue for the rest of the queries.

Code3.png

Alternative 3


  • Finally, you could use plan guide, for example:


    • My C# is converted the TSQL is this way: (@Name nvarchar(200))SELECT count(Id) FROM PerformanceVarcharNVarchar Where TextToSearch = @Name
      • If you need this info you could see it using the following TSQL if needed:


SELECT TOP 2500 databases.name, dm_exec_sql_text.text AS TSQL_Text, CAST(CAST(dm_exec_query_stats.total_worker_time AS DECIMAL)/CAST(dm_exec_query_stats.execution_count AS DECIMAL) AS INT) as cpu_per_execution, CAST(CAST(dm_exec_query_stats.total_logical_reads AS DECIMAL)/CAST(dm_exec_query_stats.execution_count AS DECIMAL) AS INT) as logical_reads_per_execution, CAST(CAST(dm_exec_query_stats.total_elapsed_time AS DECIMAL)/CAST(dm_exec_query_stats.execution_count AS DECIMAL) AS INT) as elapsed_time_per_execution, dm_exec_query_stats.creation_time, dm_exec_query_stats.execution_count, dm_exec_query_stats.total_worker_time AS total_cpu_time, dm_exec_query_stats.max_worker_time AS max_cpu_time, dm_exec_query_stats.total_elapsed_time, dm_exec_query_stats.max_elapsed_time, dm_exec_query_stats.total_logical_reads, dm_exec_query_stats.max_logical_reads, dm_exec_query_stats.total_physical_reads, dm_exec_query_stats.max_physical_reads, dm_exec_query_plan.query_plan, dm_exec_cached_plans.cacheobjtype, dm_exec_cached_plans.objtype, dm_exec_cached_plans.size_in_bytes,* FROM sys.dm_exec_query_stats CROSS APPLY sys.dm_exec_sql_text(dm_exec_query_stats.plan_handle) CROSS APPLY sys.dm_exec_query_plan(dm_exec_query_stats.plan_handle) INNER JOIN sys.databases ON dm_exec_sql_text.dbid = databases.database_id INNER JOIN sys.dm_exec_cached_plans ON dm_exec_cached_plans.plan_handle = dm_exec_query_stats.plan_handle WHERE NAME='DotNetExample' and dm_exec_sql_text.text like '%SELECT count(Id) FROM PerformanceVarcharNVarchar%' ORDER BY tsql_text DESC;


  • I created a plan guide recompiling the query every time that I executed the query in this way:


EXEC sp_create_plan_guide @name = N'Guide1', @stmt = N'SELECT count(Id) FROM PerformanceVarcharNVarchar Where TextToSearch = @Name', @type = N'SQL', @module_or_batch = null, @params = N'@Name nvarchar(200)', @hints = N'OPTION (RECOMPILE)';


  • Finally, if I need to drop the plan guide, basically, I could run the following command to delete it:  


EXEC sp_control_plan_guide N'DROP', N'Guide1';


Enjoy!


Leave a Reply

Your email address will not be published. Required fields are marked *

*

This site uses Akismet to reduce spam. Learn how your comment data is processed.