
This post has been republished via RSS; it originally appeared at: Microsoft Edge Blog.
Microsoft Edge DevTools engineer Patrick Brosset recently collected some of the web development community’s favorite tips for getting the most out of one of the most popular features of browser DevTools: the humble Console. We’ve collected a few highlights from Patrick's blog post, as well as a few tips of our own, that can help you be more productive in the DevTools.But first: What is Console?
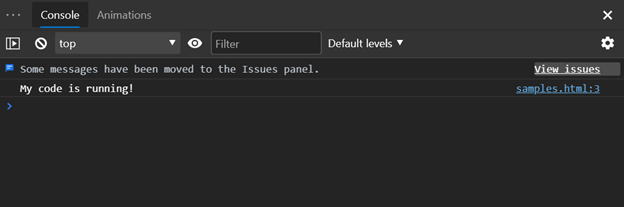
In the Microsoft Edge DevTools, the Console tool has two main functions. The first is outputting messages and errors logged from a website’s Javascript. For example, if your website code has a line of Javascript that readsconsole.log(`My code is running!`);, you would expect to get the following output in the Console tab of DevTools.
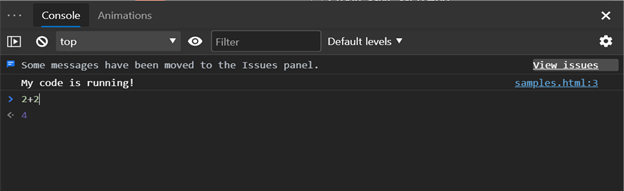
 Console’s second function is serving as a Javascript REPL, meaning you can write and run lines of Javascript directly in the tab.
 You can learn more about the basics of the Console in the Microsoft Edge DevTools Console documentation.
Tip #1: Run and rerun Console commands with multiline entry, command history, and autocomplete
Sometimes, it can be helpful to run several lines of code in the Console. Did you know you can do this by pressing Shift + Enter after each line? When multiline code is executed in the Console, all lines will be run before a result is displayed, as shown in this example.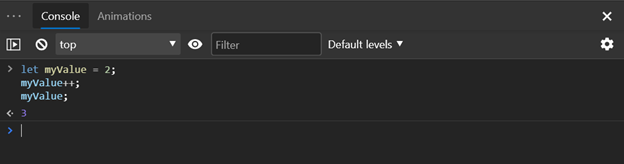 There are a few ways to reuse commands in the Console, which is especially helpful when executing complex or multiline code over and over. As in many other REPLs, you can press the up arrow in the DevTools Console to cycle back through previously-entered code. Additionally, the Console’s autocomplete feature includes history of commands you’ve entered in the past. Just start typing part of the line, and an autocomplete box will appear with recommendations.
It’s worth noting that for even longer or more complex code, you can also use the Snippets tool in DevTools. To open Snippets, select the Sources tab. Then, in the left pane, click the >> icon to reveal Snippets. From this pane, you can create, save, and reload code snippets to run at your convenience. Since snippets run as scripts rather than interactively through the REPL, only content explicitly logged to the Console will appear there when running a snippet.
There are a few ways to reuse commands in the Console, which is especially helpful when executing complex or multiline code over and over. As in many other REPLs, you can press the up arrow in the DevTools Console to cycle back through previously-entered code. Additionally, the Console’s autocomplete feature includes history of commands you’ve entered in the past. Just start typing part of the line, and an autocomplete box will appear with recommendations.
It’s worth noting that for even longer or more complex code, you can also use the Snippets tool in DevTools. To open Snippets, select the Sources tab. Then, in the left pane, click the >> icon to reveal Snippets. From this pane, you can create, save, and reload code snippets to run at your convenience. Since snippets run as scripts rather than interactively through the REPL, only content explicitly logged to the Console will appear there when running a snippet.
Tip #2: Use $ commands
The Console utilities API in DevTools provides some built-in shortcuts for entering frequently-used commands in the Console. Here are a few:| Method | Description | Example usage with result |
$() |
Returns the first element matching a given query. | > $('img').src;
< "https://docs.microsoft.com/microsoft-edge/devtools-guide-chromium/media/console-array-length.msft.png" |
$$() |
Returns an array of nodes. | > $$('*').filter(n => getComputedStyle(n).display.endsWith('flex')); // Get all flexbox containers on a page
< (3) [div.header, div.content, div.footer] |
$0 |
Returns the node currently selected in the Elements panel. | > $0.textContent
< "The Console Utilities API contains a collection of convenience commands for performing common tasks: selecting and inspecting DOM elements, displaying data in readable format, stopping and starting the profiler, and monitoring DOM events." |
$_ |
Returns the most recently-evaluated expression. | > $_.length // Get length of previous textContent result
< 239 |
Tip #3: Watch values change with live expressions
Live expressions allow you to view the result of expressions that changes over time, such as CSS properties that change during animations. Live expressions are pinned to the top of the Console and update in real time. To add a live expression to the DevTools Console, select the eye icon (?) and enter the expression you’d like to monitor.
Tip #4: Make quick network requests and more with top-level await
Top-level await (that is, an await outside an async function) is available in the DevTools Console. This opens up interesting uses for running arbitrary asynchronous Javascript. In his blog post, Patrick describes one useful way to take advantage of this when used with the fetch API:
Normally, you'd have to wrap the await statement in an async function, but for convenience, you don't have to do here in the console.The fetch API (which is basically XMLHTTPRequest but easier to use) makes it really easy to go and get resources from the network. What's really nice is that the console (both in Firefox and Chromium-based browsers) now supports top-level await statements, which means you can write something like this:
await (await fetch('https://api.github.com/repos/microsoft/vscode/issues?state=all&per_page=100&page=1')).json();And you'll have the parsed JSON from that github API call straight in your console!
Tip #5: Store data to the clipboard with copy()
In the previous example, we logged JSON comprised of 100 objects, each with its own set of properties. The result is a little hard to work with.The array then needs to be manually expanded, as well as each object within the array. However, the JSON can be easily copied to the clipboard with
> await (await fetch('https://api.github.com/repos/microsoft/vscode/issues?state=all&per_page=100&page=1')).json();
< (100) [{…}, {…}, {…}, {…}, {…}, {…}, {…}, {…}, {…}, {…}, {…}, {…}, {…}, {…}, {…}, {…}, {…}, {…}, {…}, {…}, {…}, {…}, {…}, {…}, {…}, {…}, {…}, {…}, {…}, {…}, {…}, {…}, {…}, {…}, {…}, {…}, {…}, {…}, {…}, {…}, {…}, {…}, {…}, {…}, {…}, {…}, {…}, {…}, {…}, {…}, {…}, {…}, {…}, {…}, {…}, {…}, {…}, {…}, {…}, {…}, {…}, {…}, {…}, {…}, {…}, {…}, {…}, {…}, {…}, {…}, {…}, {…}, {…}, {…}, {…}, {…}, {…}, {…}, {…}, {…}, {…}, {…}, {…}, {…}, {…}, {…}, {…}, {…}, {…}, {…}, {…}, {…}, {…}, {…}, {…}, {…}, {…}, {…}, {…}, {…}]
copy(). For example, after running the await command above, copy($_) would copy the entire JSON payload to the clipboard.
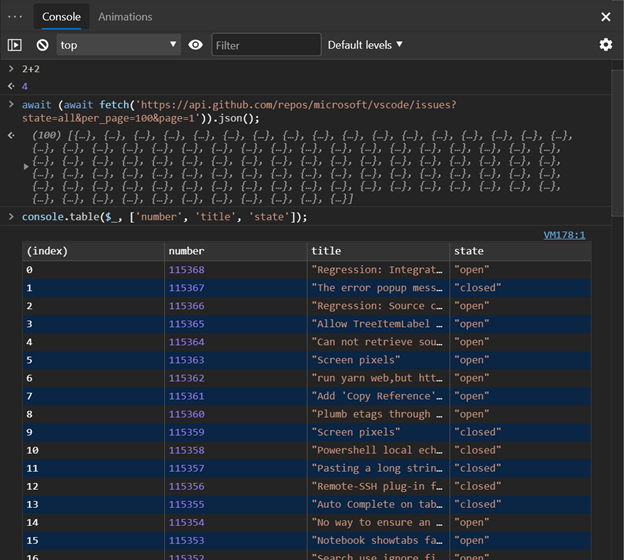
Tip #6: Format data with console.table()
Alternatively, if we just want to view the data directly in the DevTools Console, we could log it or any complex array data with console.table().
Let’s see what happens when we format the JSON result from the previous example with console.table().
 There’s much more to explore in the Console, but hopefully these tips have shown you some new ways to be more productive in the DevTools. You can stay tuned on the latest from the Microsoft Edge DevTools team by following @EdgeDevTools on Twitter.
– Rachel Simone Weil, Program Manager, Microsoft Edge DevTools
There’s much more to explore in the Console, but hopefully these tips have shown you some new ways to be more productive in the DevTools. You can stay tuned on the latest from the Microsoft Edge DevTools team by following @EdgeDevTools on Twitter.
– Rachel Simone Weil, Program Manager, Microsoft Edge DevTools