This post has been republished via RSS; it originally appeared at: Microsoft USB Blog articles.
First published on MSDN on Mar 14, 2014
By Andrea Keating [MSFT] and Arvind Aiyar [MSFT]
A common class of USB devices is the Human Interface Device (HID) class for peripherals such as keyboards, mice, game controllers etc. In Windows, the driver model for HID follows a port-miniport model with a class driver – hidclass.sys and miniport drivers like hidusb.sys, hidi2c.sys, hidbth.sys etc. for the various transports HID works with. There is a HID tutorial on MSDN for those interested in a quick HID refresher.
In this blog post we will outline how to capture event traces for the HID driver stack and how to parse and interpret them. Note that the examples below are designed with the inbox driver stack in mind but can just as easily be adapted to 3 rd party drivers as well.
Please note that if you are capturing a HID traces it may also be beneficial to capture a USB trace at the same time. You can find instructions on how to do this here .
Capturing HID event traces
You can capture HID event traces without installing any software.
1. Open an elevated command prompt window. One way is to type "command prompt" on the Start screen. Right-click on the Command Prompt shown in the result, and select Run as administrator .
2. Disconnect or disable the HID devices that you are not interested in. Fewer devices result in smaller traces making it easier to read and analyze.
3. Start a trace capture session by pasting this sequence of commands:
logman create trace -n HID_WPP -o %SystemRoot%\Tracing\HID_WPP.etl -nb 128 640 -bs 128
logman update trace -n HID_WPP -p {47c779cd-4efd-49d7-9b10-9f16e5c25d06} 0x7FFFFFFF 0xFF
rem <<optionally include mini-driver GUIDs here>>
logman start -n HID_WPP
The above commands start tracing for the HIDCLASS driver alone. Since it is typical to also trace the miniport driver at the same time, you may want to specify the trace control GUIDs for the mini-driver by including the one or more of the following set of commands in the step marked as <<optionally include mini-driver GUIDs here>>. The following are trace control GUIDs for some common inbox HID mini-drivers that Windows provides.
rem HIDUSB:
logman update trace -n HID_WPP -p {896f2806-9d0e-4d5f-aa25-7acdbf4eaf2c} 0x7FFFFFFF 0xFF
rem HIDI2C:
logman update trace -n HID_WPP -p {E742C27D-29B1-4E4B-94EE-074D3AD72836} 0x7FFFFFFF 0xFF
rem HIDBTH:
logman update trace -n HID_WPP -p {07699FF6-D2C0-4323-B927-2C53442ED29B} 0x7FFFFFFF 0xFF
rem HidBthLE:
logman update trace -n HID_WPP -p {0107cf95-313a-473e-9078-e73cd932f2fe} 0x7FFFFFFF 0xF
4. Perform the action that you want to capture. For example, plug in a keyboard that shows up as an Unknown device in Device Manager.
5. Keep the command prompt window open.
6. Stop the session when you're finished by pasting this sequence of commands:
logman stop -n HID_WPP
logman delete -n HID_WPP
move /Y %SystemRoot%\Tracing\HID_WPP_000001.etl %SystemRoot%\Tracing\HID_WPP.etl
The preceding capture session generates an ETL file named HID_WPP.etl . The trace file is stored in the %SystemRoot%\Tracing directory e.g. C:\Windows\Tracing\HID_WPP.etl . Move the file to another location or rename it in order to avoid overwriting it when you capture the next session.
Capturing Boot traces (special commands)
If you want to view traces of the activity that takes place when the system boots, you need a different set of commands. This way of capturing traces can be useful if you encounter an issue that occurs only when the system boots, rather than while the system is running. The way to do that is to prepend the trace statements above with the autosession keyword:
logman create trace autosession\HIDBootTrace -o HIDBootTrace.etl -nb 128 640 -bs 128
logman update trace autosession\HIDBootTrace -p {47c779cd-4efd-49d7-9b10-9f16e5c25d06} 0x7FFFFFFF 0xFF
rem <<optionally include mini-driver GUIDs here>>
After that you should reboot. When you are done with the trace, you can stop the trace as follows.
logman stop HIDBootTrace
logman delete autosession\HIDBootTrace –ets
In this case, you will find the trace file (HIDBootTrace.etl) in the directory where you ran the commands that started the trace. Note that if you reboot before you stop the trace, the trace file will be overwritten.
Parsing the trace logs using TraceView
For more information and detailed instructions about using TraceView to view existing ETL logs, see Displaying a Trace Log with a PDB File .
1. Start TraceView .
2. On the File menu, click Open Existing Log File.
3. In the Log File Name box, type the path and name of an event trace log file (.etl). From the above example, the name of the captured event trace log file is HID_WPP.etl.
4 . Click OK .
5 . You will need the PDB file for the binary that contains the WPP trace information. Download the PDB file that matches the specified binary file to the specified local directory using the following command:
Symchk.exe <binary file> /s SRV*<local directory to download symbols to>*<symbol server>
For more information about Microsoft symbol servers, see Use the Microsoft Symbol Server to obtain debug symbol files . The SymChk.exe utility is included with the Debugging Tools for Windows package.
6. For this example, get the PDB file from Microsoft’s public symbol server for the hidclass.sys binary.
C:\Symbols> symchk C:\windows\system32\drivers\hidclass.sys /s SRV*C:\Symbols*http://msdl.microsoft.com/downloads/symbols
SYMCHK: FAILED files = 0
SYMCHK: PASSED + IGNORED files = 1
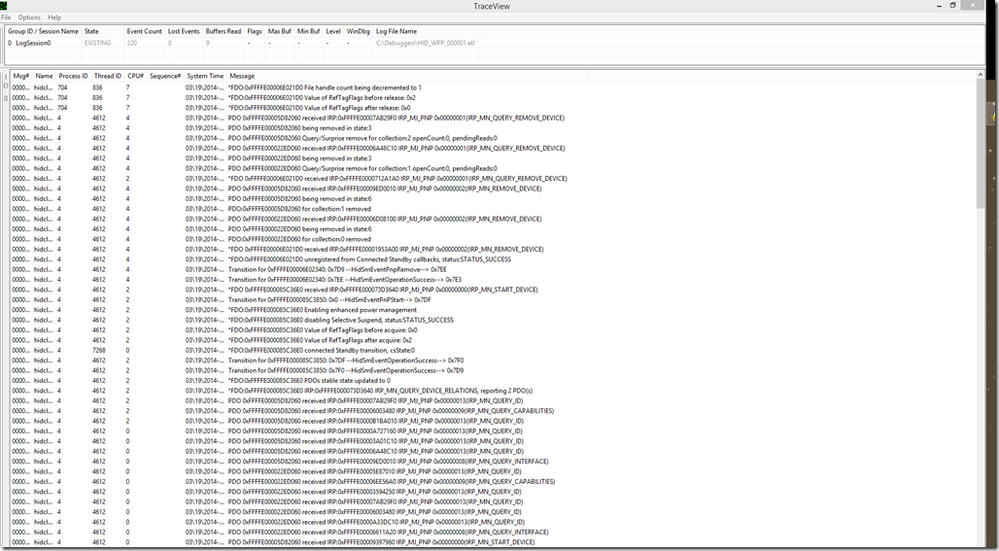
7. Click PDB (Debug Information) File and type the path to the PDB file that was used to directly or indirectly (by using control GUID) capture the WPP traces. For this example it’s C:\sym\hidclass.pdb\814C30D8D5ED4FAD821B8BFBAD2D0B922\hidclass.pdb. Note that you will need to repeat the process for the mini-driver binaries as well.
8. Click OK . You should get an output window similar to the one below.