This post has been republished via RSS; it originally appeared at: Windows Dev AppConsult articles.
In the previous post we have learned some basic concepts of Kubernetes and how it helps us to leverage Docker containers in a better way. However, the samples we used in the previous post have been helpful to understand the basics, but they aren't realistic. If you remember, as first step we have manually created a deployment using the NGINX image published on Docker Hub. However, in a real scenario, you will hardly have to manually create deployments and services. The second sample was closer to the real world, since we have used a more formal definition (the Docker Compose file) to deploy the whole architecture of our application. However, it still wasn't completely realistic, because we were taking advantage of the Kubernetes engine built-in inside Docker, which allowed us to use a Docker Compose file to describe the deployment. When you use a real Kubernetes infrastructure, you can't leverage Docker Compose files, but you need to create a YAML file which follows the Kubernetes specification.
In this post we're going to do exactly that: we're going to write a Kubernetes YAML definition to map our application and we're going to deploy it in the cloud, using Azure Kubernetes Service. Then, we're going to see how can easily scale our application in case of heavy load.
Let's start!
Writing our first YAML file
Let's start with something simple. In the previous post, as first step, we have manually created a deployment using the kubectl run command, followed by kubectl expose to create a service so that we could connect to the web server from our machine. Let's create a YAML file to achieve the same goal:
---
apiVersion: apps/v1beta1
kind: Deployment
metadata:
  name: web
spec:
  replicas: 5
  template:
    metadata:
      labels:
        app: web
    spec:
      containers:
      - name: web
        image: nginx
        ports:
        - containerPort: 80
---
apiVersion: v1
kind: Service
metadata:
  name: web
spec:
  type: LoadBalancer
  ports:
  - port: 80
  selector:
    app: web
Each definition is composed by three items:
- kind specifices which kind of Kubernetes resource we want to deploy. This is a big difference compared to Docker Compose files. We have to specify each Kubernetes object, which means that a single layer of application is typically composed by at least two objects: a deployment (with the app definition) and a service (to expose it to the other applications or to the outside world).
- metadata allows to specify some information that are helpful to describe the object. In this case we're setting a name to make it easyer to identify the resource.
- spec contains the full specification of the resource we want to deploy. The content of this section can be very different, based on the kind of resource. For example, you can notice how the spec section of the first resource (Deployment) is different from the one of the second resource (Service).
Let's take a closer look at the first section. Since it's used to setup a deployment, the spec section contains all the information about the application we want to deploy and its desired state. We have defined a template with a single container, called web, which is based on the nginx image. We have also specified that we want 5 replicas of this application as desired state. The expected outcome is that, like we have seen in the previous article when we have used the kubectl scale command, Kubernetes will take care of creating (and always keeping alive) 5 pods out of this deployment.
The second section, instead, is dedicated to configure the service and, as such, you have less options. It's enough to specify the type (LoadBalancer, since we want to expose the web server to the outside world) and the exposed port. A very important property is selector, which allows us to specify which deployment we want to expose through this service. In our case, it's the resource identified by the web label we have just created in the first section.
Now that the we have the full definition of our application, we can deploy it with the following command:
PS> kubectl apply -f web.yml
deployment.apps/web created
service/web created
We use the kubectl apply command, specifying as parameter the path of the YAML file which we have just created. Now we can use the usual kubectl commands to check what happened. Let's see first the deployments:
PS> kubectl get deployments
NAME   READY   UP-TO-DATE   AVAILABLE   AGE
web    5/5     5            5           4m9s
We have a new deployment called web, which is composed by 5 instances. We can see them in more details by getting the list of pods:
PS> kubectl get pods
NAME                  READY   STATUS    RESTARTS   AGE
web-d54594dc4-7pt9d   1/1     Running   0          83s
web-d54594dc4-ddpgv   1/1     Running   0          83s
web-d54594dc4-kqnsq   1/1     Running   0          83s
web-d54594dc4-srcxl   1/1     Running   0          83s
web-d54594dc4-x2p48   1/1     Running   0          83s
Last, we can check the available services:
PS> kubectl get services
NAME         TYPE           CLUSTER-IP       EXTERNAL-IP   PORT(S)        AGE
kubernetes   ClusterIP      10.96.0.1        <none>        443/TCP        3d3h
web          LoadBalancer   10.110.107.154   localhost     80:30514/TCP   91s
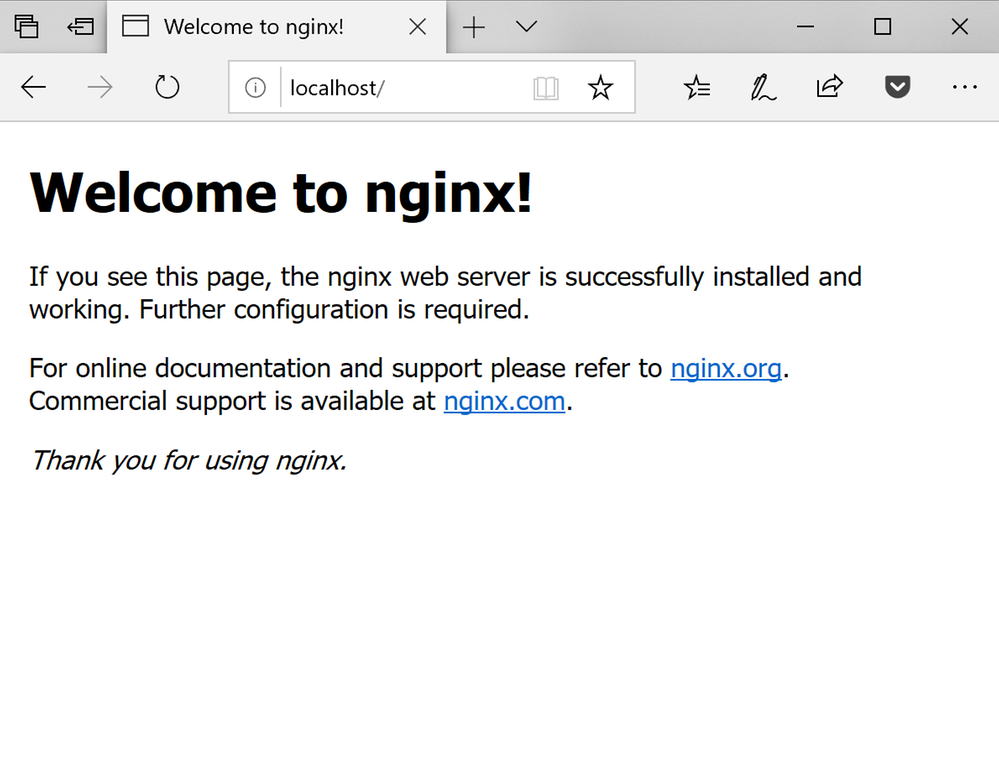
Since the service's type we have created is LoadBalancer, our application is exposed to the outside world through an external ip. Since we're running our Kubernetes cluster on our local machine, it means that we can open a browser and hit http://localhost to see the default NGINX page:
Azure Kubernetes Service
Now that we have learned to create a proper YAML file, we can try to deploy our application in a real environment like Azure Kubernetes Service (AKS, from now on). AKS is one of the many Azure services which belongs to the PaaS (Platform-As-A-Service) world. It means that we can deploy a Kubernetes cluster without having to worry about manually creating, maintaining and configuring the virtual machines. We will just have to create a new cluster, specify how much power we need (which translates into the CPU, RAM, hard disk, etc. which our VM will have) and how many nodes we need.
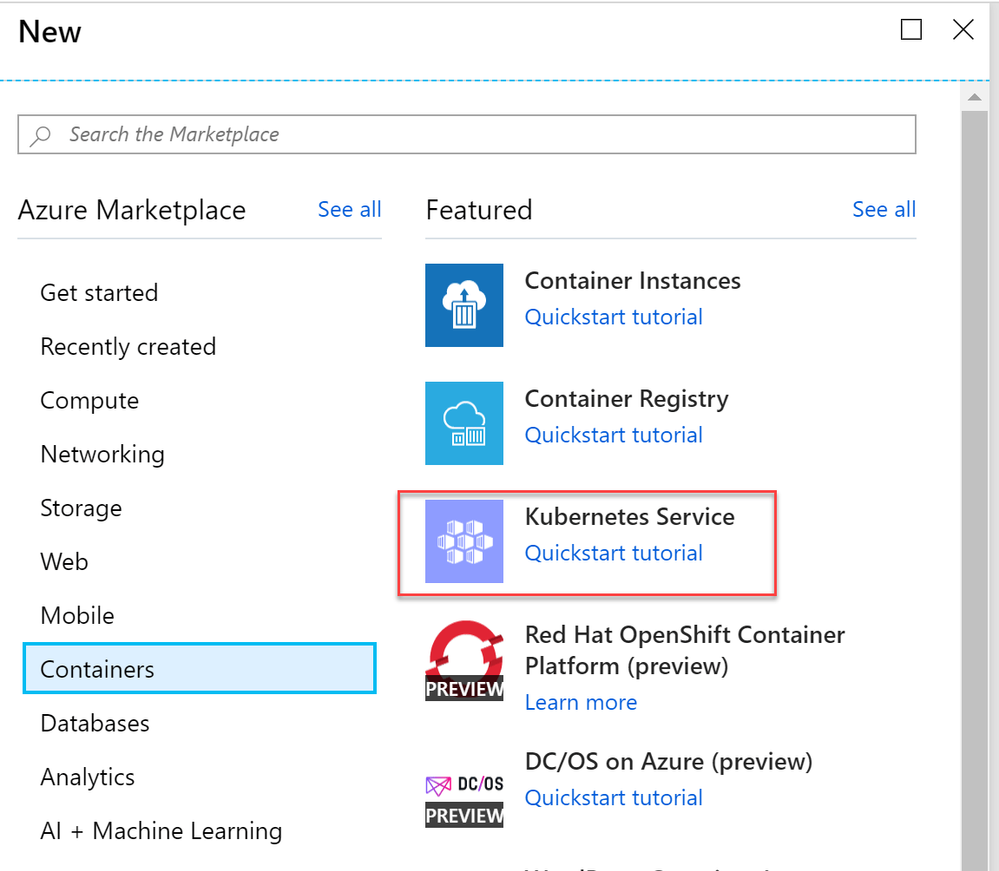
In order to start with Azure Kubernetes Service, login with your account on the Azure portal and choose Create a resource. Under the Containers category you will find the Kubernetes service:
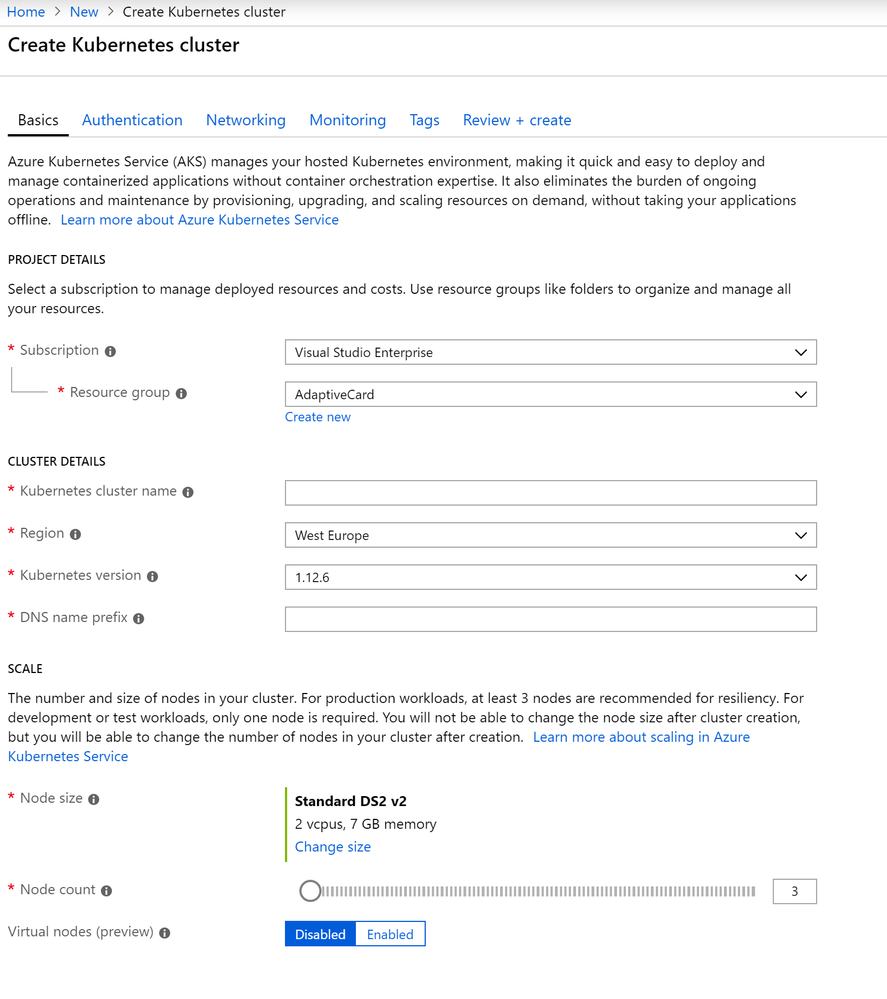
Select it to start the process of creating a new Kubernetes cluster:
In the first section you just have to select the Subscription you want to leverage and the resource group where you want to store all the resources related to the cluster. For keeping things better organized, I prefer to create a dedicated resource group for AKS.
In the Cluster Details section you can configure all the settings of the cluster:
- Kubernetes cluster name is the name which identifies the cluster
- Region is the Azure region where you want to create the cluster. Choose a region close to you for lower latency.
- Kubernetes version should be self-explanatory. Just leave the default one.
- DNS name prefix is the prefix that will be used for the full URL assigned to the cluster.
In the end, you need to choose how much resoruces you need, based on the requirements of your application. You will have to choose:
- The size of the VMs which will be used as nodes. You can choose between different sizes, with different amount of RAM, CPU cores, etc. This choice must be done carefuly, because you won't be able to change it later.
- The number of nodes you want to create. This value, instead, can be changed also later if you need to scale your application up or down.
The last option lets you enable a preview feature called Virtual nodes, which is a new Azure feature to leverage Kubernetes with a serverless approach. We have just shared that AKS uses the PaaS approach, which means that you don't have to care about the underlying infrastructure, but you still have to choose the size of the VMs that will power up each node. As a consequence, scaling up could take a while, because AKS will need to spin up new VMs if you need more nodes. Virtual nodes, instead, allow to quickly spin up new nodes beyond the size of the cluster you have defined, by leveraging Azure Container Instances. For the moment, we aren't going to leverage it, so feel free to leave it disabled.
Press Review + Create to kick off the deployment process, which will take a while. Once it's finished, you will have a new Kubernetes cluster up & running.
Now we need to connect to it. The easiest way is through the Azure CLI (Command Line Interface), which can configure the kubectl tool to connect directly to AKS. If you don't have the Azure CLI on your machine, you can get in different ways based on your environment. You can leverage the Windows installer, you can use the Windows Subsystem for Linux (WSL) or you can even run it inside a Docker container.
No matter which path you choose, at the end you'll be able to use a command prompt to execute commands against your Azure subscription. The first step is to execute the login command:
PS> az login
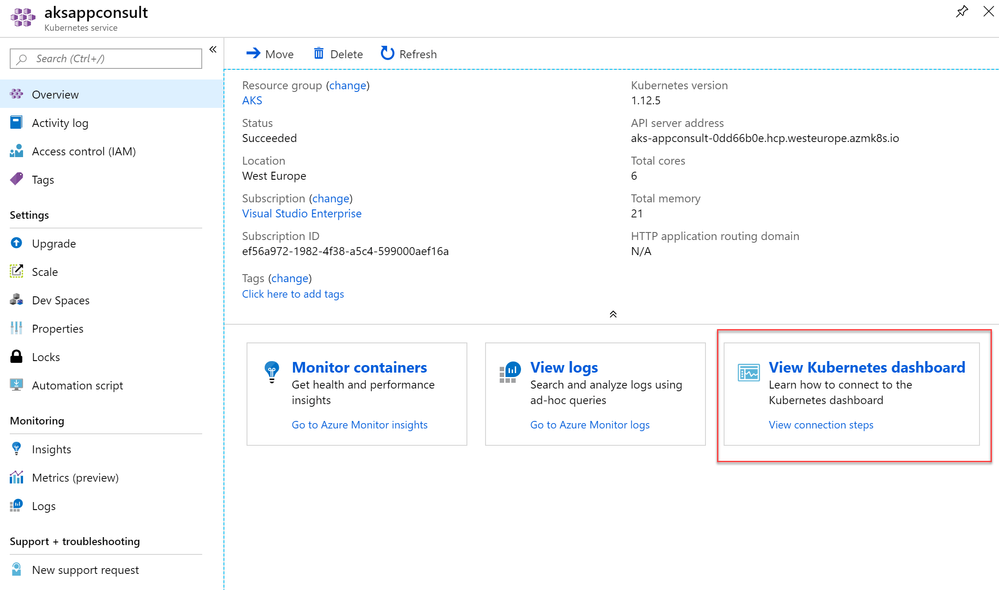
Your default browser will open up and you will be asked to login to your Azure subcription. Once you're logged in, you're ready to interact with the resources you have in your subscription. The easiest way to connect to your AKS cluster is to open the Azure dashboard and, in the Overview section, choose View Kubernetes dashboard.
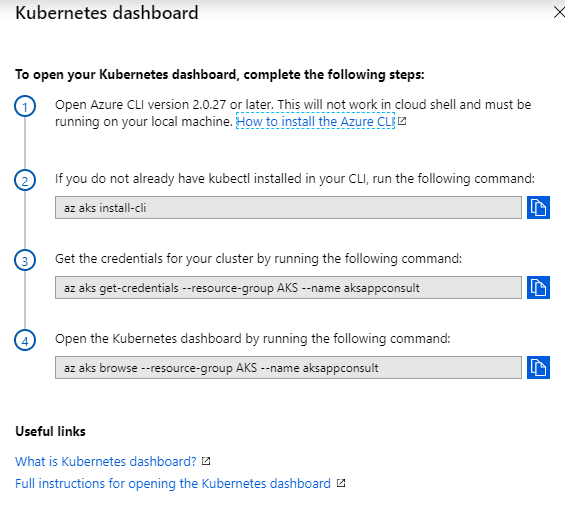
A new panel will open up from the right with a set of Azure CLI commands:
The first one will install kubectl on your local machine, even if you should already have it thanks to Docker Desktop:
PS> az aks install-cli
Now you can connect to your AKS instance by copying and pasting the second command:
PS> az aks get-credentials --resource-group AKS --name aksappconsult
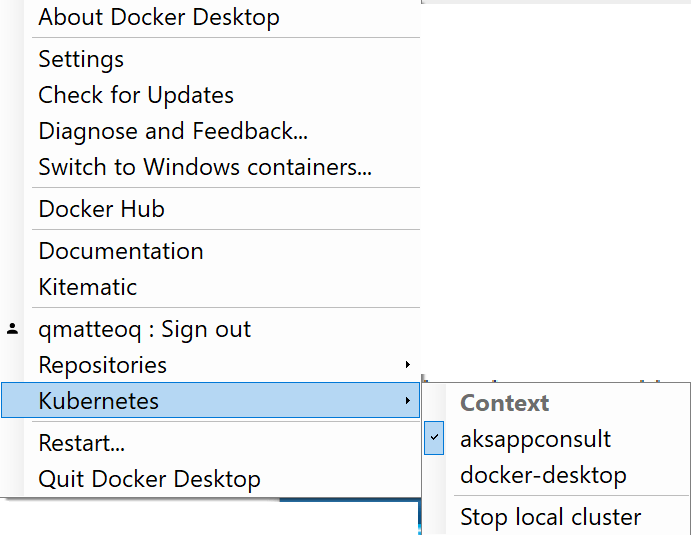
Make sure to copy and paste the command from your dashboard and not the one above. In fact, you need to be sure that the --resource-group and the --name parameters are set with the specific values of your cluster. This command will store in the local Kubernetes configuration file the new context. If you have done everything properly, you should see something like this when you click on the Docker Desktop icon in your taskbar and you choose Kubernetes:
As you can see, there are two contexts listed in the menu:
- The first is the one related to AKS we have just created (aksappconsult is the name of the AKS cluster I've created in my Azure portal)
- The second is the local one created by Docker Desktop and which we have used in the previous post
Make sure that the AKS context is set. Now we can start using the kubectl tool against our AKS cluster. We can immediately see that by getting the list of available nodes:
PS> kubectl get nodes
NAME                       STATUS   ROLES   AGE    VERSION
aks-agentpool-27951239-0   Ready    agent   5d1h   v1.12.5
aks-agentpool-27951239-1   Ready    agent   5d1h   v1.12.5
aks-agentpool-27951239-2   Ready    agent   5d1h   v1.12.5
virtual-node-aci-linux     Ready    agent   5d     v1.13.1-vk-v0.7.4-44-g4f3bd20e-dev
When I created my AKS cluster, I've specified that I wanted 3 nodes and I've enabled the Virtual Node option. As such, the output of the command is the expected one: we have 3 physical nodes and a virtual one, called virtual-node-aci-linux.
Now it comes the fun part! Since we're connected to our AKS cluster, the same exact kubectl commands we have previously executed on our local cluster will work exactly in the same on our cloud cluster. For example, let's try to deploy the sample YAML file we have previously created:
PS> kubectl apply -f web.yml
deployment.apps/web created
service/web created
The outcome will be exactly the same but, this time, our NGINX instance will be deployed on the cloud. We can use the usual commands to see that everything is indeed up & running. First, let's take a look at the deployments:
PS> kubectl get deployments
NAME   DESIRED   CURRENT   UP-TO-DATE   AVAILABLE   AGE
web    5         5         5            5           94m
Then let's take a look at the pods:
PS> kubectl get pods
NAME                   READY   STATUS    RESTARTS   AGE
web-64888dbd49-j4nbr   1/1     Running   0          94m
web-64888dbd49-n4s8s   1/1     Running   0          94m
web-64888dbd49-rb2x9   1/1     Running   0          94m
web-64888dbd49-wgnlm   1/1     Running   0          94m
web-64888dbd49-zd4h7   1/1     Running   0          94m
No surprises here. It's the same exact scenario that we saw when we deployed the YAML locally. We can see only a small difference when we look at the services:
PS> kubectl get services
NAME         TYPE           CLUSTER-IP   EXTERNAL-IP   PORT(S)        AGE
kubernetes   ClusterIP      10.0.0.1     <none>        443/TCP        5d1h
web          LoadBalancer   10.0.1.69    <pending>     80:30216/TCP   6s
This time we aren't exposing the application on our local machine, but on a remote server. As such, the external IP takes a while to be assigned so, at first, you will see pending as value. You can add a watch to be notified when the external IP is assigned using the following command:
PS> kubectl get services web --watch
NAME   TYPE           CLUSTER-IP   EXTERNAL-IP   PORT(S)        AGE
web    LoadBalancer   10.0.1.69    <pending>     80:30216/TCP   23s
web   LoadBalancer   10.0.1.69   65.52.134.127   80:30216/TCP   39s
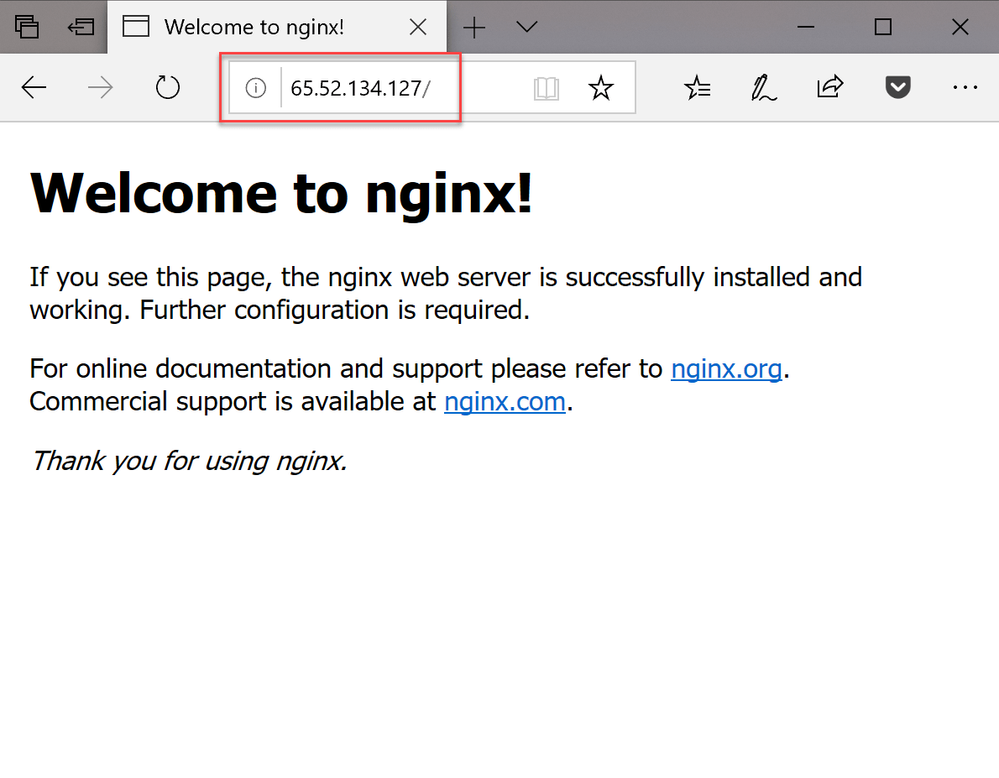
At first, you will see just the first line but, as soon as the IP is assigned, a new one will pop up. Now you can just copy the value from the EXTERNAL-IP column and paste it in your browser to see the default NGINX web page:
A more complex deployment
The experiment we have just did was helpful to understand the basic concepts of AKS. In the end, the only difference from what we have learned in the first post is about setting up the environment. Once it's up & running, we can execute the same exact commands we were running on our local Kubernetes cluster.
However, it isn't a very realistic scenario because the application is very simple and made by a single layer. Let's deploy on AKS the original web application we are using as playground in the various posts. However, as first, we need to create the YAML definition since, at the moment, we have only a Docker Compose file that we can't deploy as it is on AKS. As a reminder, this is the structure of our project:
version: '3'
services:
  web:
    image: qmatteoq/testwebapp
    ports:
      - "1983:80"
  newsfeed:
    image: qmatteoq/testwebapi
  redis:
    image: redis
We need to convert these 3 layers into a Kubernetes YAML file. Let's start with the Redis cache:
apiVersion: apps/v1beta1
kind: Deployment
metadata:
  name: redis
spec:
  replicas: 1
  template:
    metadata:
      labels:
        app: redis
    spec:
      containers:
      - name: redis
        image: redis
        ports:
        - containerPort: 6379
          name: redis
---
apiVersion: v1
kind: Service
metadata:
  name: redis
spec:
  ports:
  - port: 6379
  selector:
    app: redis
---
If you remember what we have learned in the previous post, we need to define at least two resources for each layer. We need, in fact, a service for any deployment which must be exposed, regardless if it will be only internally or externally.
The first element, which kind is Deployment, defines the layer for the Redis cache. It's based on the official redis image on Docker Hub, it's exposed as a single instance and it's identified by the redis name. Naming is important, since it's the one that will be used by Kubernetes through the internal DNS. If you remember, in fact, our Web API connects to the Redis cache using redis as server name.
The second one, instead, is the Service and it exposes the redis deployment through the 6379 port, which is the default Redis one. Since we haven't specified the type property, the service will be exposed only in the internal network.
Now let's move to the Web API layer:
apiVersion: apps/v1beta1
kind: Deployment
metadata:
  name: newsfeed
spec:
  replicas: 1
  template:
    metadata:
      labels:
        app: newsfeed
    spec:
      containers:
      - name: newsfeed
        image: qmatteoq/testwebapi
        ports:
        - containerPort: 80
          name: newsfeed
---
apiVersion: v1
kind: Service
metadata:
  name: newsfeed
spec:
  ports:
  - port: 80
  selector:
    app: newsfeed
---
The structure is the same we have used for Redis. We have a Deployment entry which defines a single instance based on the qmatteoq/testwebapi image on Docker Hub, which is identified by the newsfeed label. Also in this case, newsfeed is the name used in the internal DNS. The web application, in fact, connects to the Web API using the http://newsfeed URL. The second section, instead, defines a service which exposes the deployment through the 80 port in the internal network.
Now let's take a look at the final section of the YAML file: the main web application.
apiVersion: apps/v1beta1
kind: Deployment
metadata:
  name: web
spec:
  replicas: 3
  template:
    metadata:
      labels:
        app: web
    spec:
      containers:
      - name: web
        image: qmatteoq/testwebapp
        ports:
        - containerPort: 80
---
apiVersion: v1
kind: Service
metadata:
  name: web
spec:
  type: LoadBalancer
  ports:
  - port: 80
  selector:
The Deployment section has always the same structure. It creates a deployment based on the qmatteoq/testwebapp image on Docker Hub. The only difference is that we want 3 instances of this layer. The second section, instead, is a bit different because we have added a type property set to LoadBalancer. This means that we want to expose the layer through the 80 port, but externally and not only internally.
For reference, this is how the full YAML file looks like:
apiVersion: apps/v1beta1
kind: Deployment
metadata:
  name: redis
spec:
  replicas: 1
  template:
    metadata:
      labels:
        app: redis
    spec:
      containers:
      - name: redis
        image: redis
        ports:
        - containerPort: 6379
          name: redis
---
apiVersion: v1
kind: Service
metadata:
  name: redis
spec:
  ports:
  - port: 6379
  selector:
    app: redis
---
apiVersion: apps/v1beta1
kind: Deployment
metadata:
  name: newsfeed
spec:
  replicas: 1
  template:
    metadata:
      labels:
        app: newsfeed
    spec:
      containers:
      - name: newsfeed
        image: qmatteoq/testwebapi
        ports:
        - containerPort: 80
          name: newsfeed
---
apiVersion: v1
kind: Service
metadata:
  name: newsfeed
spec:
  ports:
  - port: 80
  selector:
    app: newsfeed
---
apiVersion: apps/v1beta1
kind: Deployment
metadata:
  name: web
spec:
  replicas: 3
  template:
    metadata:
      labels:
        app: web
    spec:
      containers:
      - name: web
        image: qmatteoq/testwebapp
        ports:
        - containerPort: 80
---
apiVersion: v1
kind: Service
metadata:
  name: web
spec:
  type: LoadBalancer
  ports:
  - port: 80
  selector:
    app: web
Save this file and give it a name. Now we're ready to deploy it on AKS using the kubectl apply command:
PS> kubectl apply -f ".\web-aks.yml"
Can you guess which is the outcome? We should have now 3 deployments:
PS> kubectl get deployments
NAME       DESIRED   CURRENT   UP-TO-DATE   AVAILABLE   AGE
newsfeed   1         1         1            1           25m
redis      1         1         1            1           25m
web        3         3         3            3           25m
These deployments should have kicked off 5 pods, since we have asked for 3 replicas of the web layer:
kubectl get pods
NAME                        READY   STATUS    RESTARTS   AGE
newsfeed-595d865b75-t4j79   1/1     Running   0          25m
redis-56f8fbc4d-lvxj8       1/1     Running   0          25m
web-7658cd5c85-9kbx9        1/1     Running   0          25m
web-7658cd5c85-dkq9b        1/1     Running   0          25m
web-7658cd5c85-rdc52        1/1     Running   0          25m
In the end, we should have 4 services:
PS> kubectl get services
NAME         TYPE           CLUSTER-IP     EXTERNAL-IP     PORT(S)        AGE
kubernetes   ClusterIP      10.0.0.1       <none>          443/TCP        5d3h
newsfeed     ClusterIP      10.0.142.105   <none>          80/TCP         23m
redis        ClusterIP      10.0.252.243   <none>          6379/TCP       23m
web          LoadBalancer   10.0.177.19    13.80.251.199   80:30474/TCP   24m
Only the web one, which type is LoadBalancer, will have an external IP. As we have seen when we have deployed NGINX, it may take a while before the external IP is assigned, so you can use the following command to track it:
PS> kubectl get service web --watch
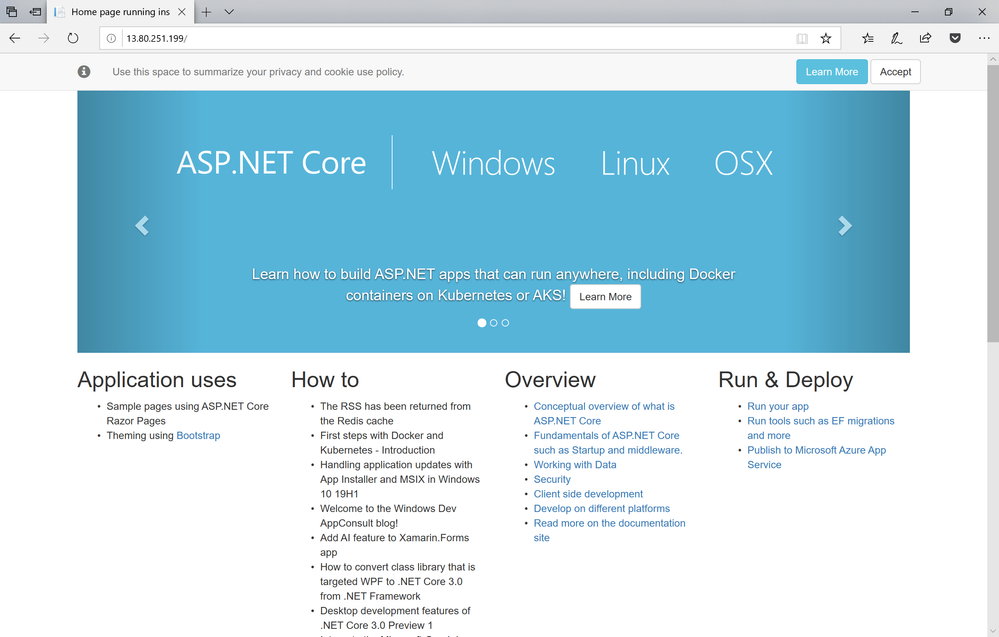
Once the external IP is available, you can just open your browser pointing to it to see our web application up & running in the cloud:
The advantage of using a YAML definition is that, unlike we have seen in the previous post with Docker Compose, we are allowed to change it for scaling purpose. For example, let's run the following command:
PS> kubectl scale deployments newsfeed --replicas=4
deployment.extensions/newsfeed scaled
After a few seconds, you should see 3 more pods up & running for the newsfeed deployment:
PS> kubectl get pods
NAME                        READY   STATUS    RESTARTS   AGE
newsfeed-595d865b75-2ql4h   1/1     Running   0          24s
newsfeed-595d865b75-mk47m   1/1     Running   0          24s
newsfeed-595d865b75-t4j79   1/1     Running   0          30m
newsfeed-595d865b75-vc4mp   1/1     Running   0          24s
redis-56f8fbc4d-lvxj8       1/1     Running   0          30m
web-7658cd5c85-9kbx9        1/1     Running   0          30m
web-7658cd5c85-dkq9b        1/1     Running   0          30m
web-7658cd5c85-rdc52        1/1     Running   0          30m
However, the most interesting aspect of the cloud is that you can easily scale automatically. Having to manually scale our deployments, in fact, isn't a very realistic scenario, since we can't always predict peaks.
Setting up auto-scale
The first step to setup auto scaling is to define, for the layers of your application, how many resources they can use. We can do this by using the resources property in a YAML file. Here is how we can update, for example, the web deployment of our application:
apiVersion: apps/v1beta1
kind: Deployment
metadata:
  name: web
spec:
  replicas: 3
  template:
    metadata:
      labels:
        app: web
    spec:
      containers:
      - name: web
        image: qmatteoq/testwebapp
        ports:
        - containerPort: 80
        resources:
          requests:
            cpu: 250m
          limits:
            cpu: 500m
As you can see, we have added a new resources entry which specifies that the container is going to request 0.25 CPU, with a maximum allowed of 0.5. Now that we have defined these limits, we can apply again our YAML file:
PS> kubectl apply -f "./web-aks.yml"
The advantage of using the kubectl apply command is that it doesn't wipe and reload the whole configuration, but it just applies the changes compared to the previous configuration. As a consequence, the newsfeed and redis deployments will be untouched. Only the web deployment will be updated, which will cause the various pods which hosts it to be terminated and recreated. Now we are ready to setup the auto scaling. You can set scaling rules using the kubectl autoscale command, as in the following example:
PS> kubectl autoscale deployment web --cpu-percent=15 --min=3 --max=10
We're telling to Kubernetes that we want the web deployment to automatically scale up when the CPU usage of the node goes above 15%, from a minimum of 3 pods to a maximum of 10 pods. Of course, this is an unrealistic example, since 15% is a too low threshold. However, thanks to this value we'll be able to easily test if the auto scaling works.
We can check the status of the configuration with the following command:
PS> kubectl get hpa
NAME   REFERENCE        TARGETS   MINPODS   MAXPODS   REPLICAS   AGE
web    Deployment/web   4%/15%    3         10        3          19h
In the Targets column we can see, as first value, the current threshold followed by the limit we have set (15%). Initially, the current threshold might be missing because Kubernetes will start to track it after the creation of the autoscale rule. As such, you might need to wait for a while before seeing a value there. From the other columns we can see that right now the application isn't under heavy load and, as such, Kubernetes is maintaining 3 pods, which is the minimum value we have set. Now let's try to stress a bit our application to see if the auto scale kicks in. There are many tools and platforms to perform stress testing. The one I've chosen for my tests is Loader.io, which has a generous free tier. It allows, in fact, to simulate up to 1000 concurrent clients using the free version, which is more than enough to stress our application for demo purposes.
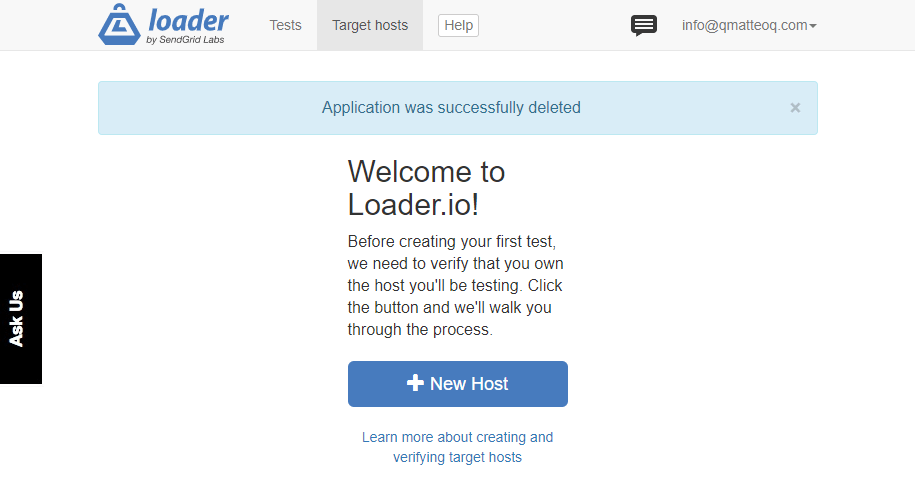
Once you have created an account and verified it, you'll be asked to add a new host:
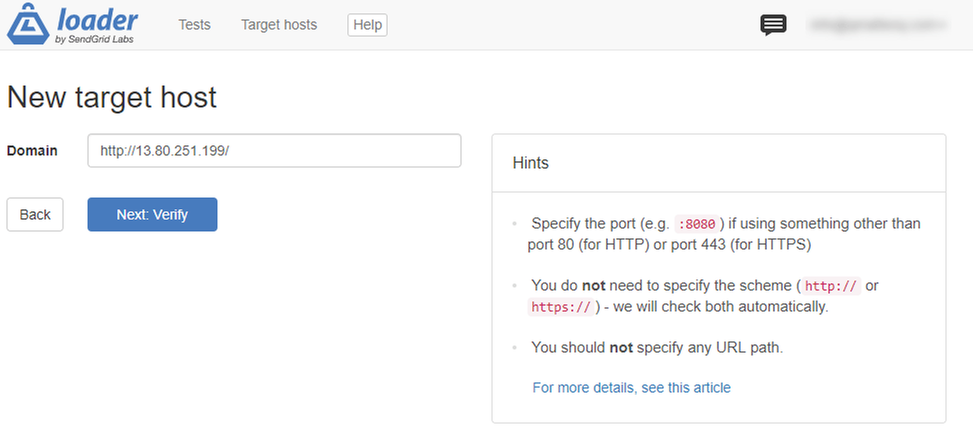
As first step, you will have to specify the full URL of your application. In our case, it's the one assigned by AKS to our Load Balancer, which you can retrieve using the kubectl get services command in case you have forgotten it:
PS> kubectl get services
NAME         TYPE           CLUSTER-IP     EXTERNAL-IP     PORT(S)        AGE
kubernetes   ClusterIP      10.0.0.1       <none>          443/TCP        5d23h
newsfeed     ClusterIP      10.0.142.105   <none>          80/TCP         20h
redis        ClusterIP      10.0.252.243   <none>          6379/TCP       20h
web          LoadBalancer   10.0.177.19    13.80.251.199   80:30474/TCP   20h
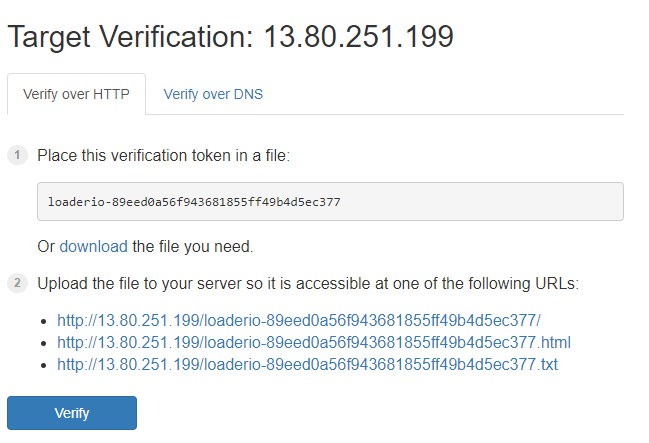
Once you move on to the next step, you will be asked to verify that you're indeed the owner of the website. It's a security measure to avoid that you can put under stress websites you don't own for malicious purposes. You will see a page like this:
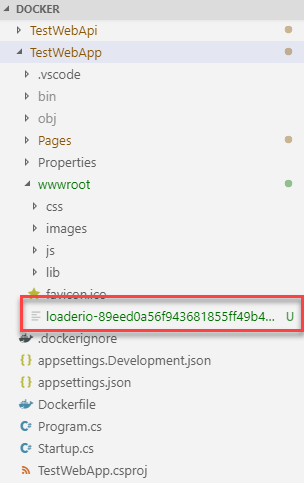
We need to add a file in our web application with the provided token. However, in our scenario, we can't just upload the file over a FTP or similar, because we are running our web application inside a container. As such, let's start to download the proposed TXT file. Then open the folder which contains the web application and copy it inside the wwwroot subfolder:
Now we need to rebuild again the image:
PS> docker build -t "qmatteoq/testwebapp" .
And finally we can push the updated image to Docker Hub:
PS> docker push qmatteoq/testwebapp:latest
Now we need to update our deployment image, by using the same command we have seen in the previous post:
PS> kubectl set image deployment web web=qmatteoq/testwebapp:latest
After a few seconds, Kubernetes will replace all the running pods of the web application with an updated version which contains the text file we've added. We can verify it by opening with our browser the link suggested by the Loader.io website (it will be something like http://13.80.251.199/loaderio-89eed0a56f943681855ff49b4d5ec377.txt). If we can see the content of the file like in the below image, we're good to go:
Now you can go back to the Loader.io wizard and press the Verify button. The process should complete without errors and propose you to create a new test, thanks to the New test button:
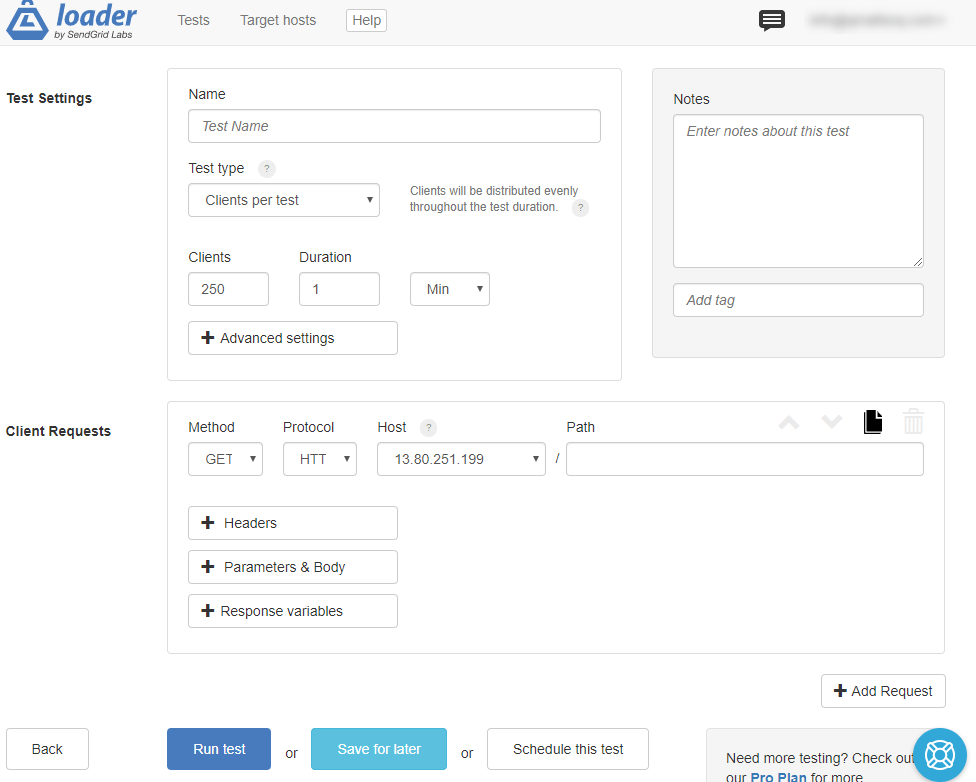
Set the following fields:
- Name: choose the name you prefer to identify the test (for example, Stress test).
- Test type: choose Clients per second
- Clients: type 500
- Duration: leave 1 minute. In the free plan you can't define a longer timeframe.
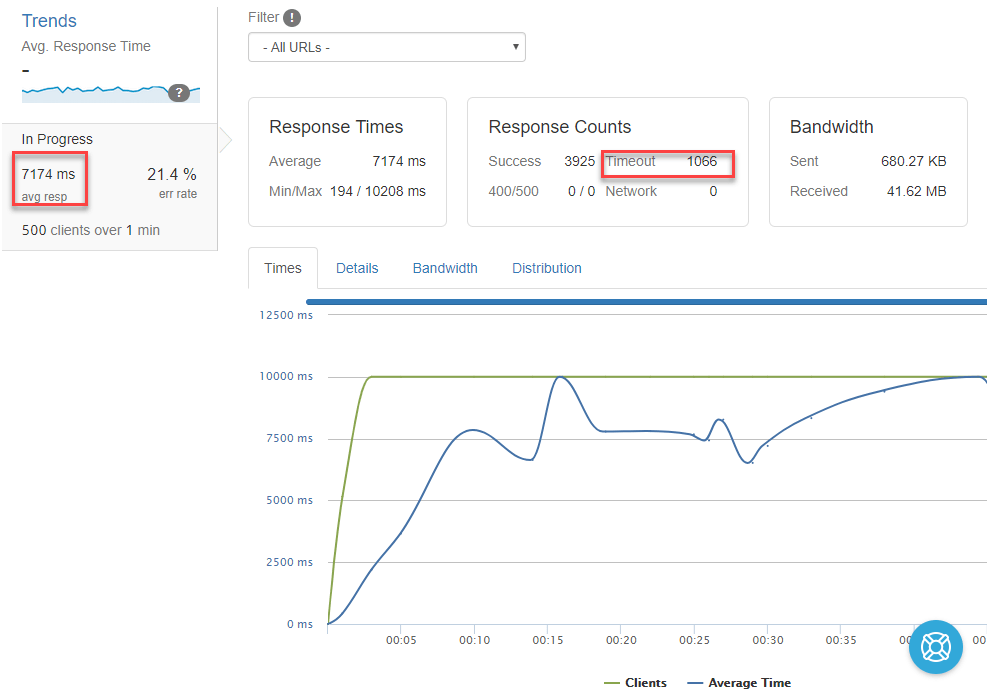
This test will execute 500 HTTP GETs per second to our web application for 1 minute. Press Run test to start the experiment. During the execution, you will see many useful information, like the average response time and a chart with the number of requests being executed. You will quickly start to notice that the average time will start to grow significantly over time and you will have many timeouts:
Try to repeat the test multiple times and, in the meantime, use the kubectl get hpa command to track the scaling status. At some point, you will see something like this:
PS> kubectl get hpa
NAME   REFERENCE        TARGETS   MINPODS   MAXPODS   REPLICAS   AGE
web    Deployment/web   22%/15%   3         10        5          19h
As you can see, the current target is higher than the one we have set, so Kubernetes has started to spin up more pods. The Replicas column, in fact, is showing a value of 5 instead of the usual 3 one. Additionally, if you check the list of pods, we will see new pods spinning up:
PS> kubectl get pods
NAME                        READY   STATUS              RESTARTS   AGE
newsfeed-595d865b75-t4j79   1/1     Running             0          19h
redis-56f8fbc4d-lvxj8       1/1     Running             0          19h
web-7db6cdbcfc-655kk        1/1     Running             0          118s
web-7db6cdbcfc-8bdxc        0/1     ContainerCreating   0          3s
web-7db6cdbcfc-8pd25        1/1     Running             0          2m1s
web-7db6cdbcfc-944g4        0/1     ContainerCreating   0          3s
web-7db6cdbcfc-z9pzt        1/1     Running             0          2m5s
Now, if you stop running the stress test and you leave your web application idle for a while, you will notice that at some point Kubernetes will scale down your solution since the CPU usage is below the target:
PS> kubectl get hpa
NAME   REFERENCE        TARGETS   MINPODS   MAXPODS   REPLICAS   AGE
web    Deployment/web   8%/15%    3         10        3          19h
Monitoring your cluster thanks to AKS
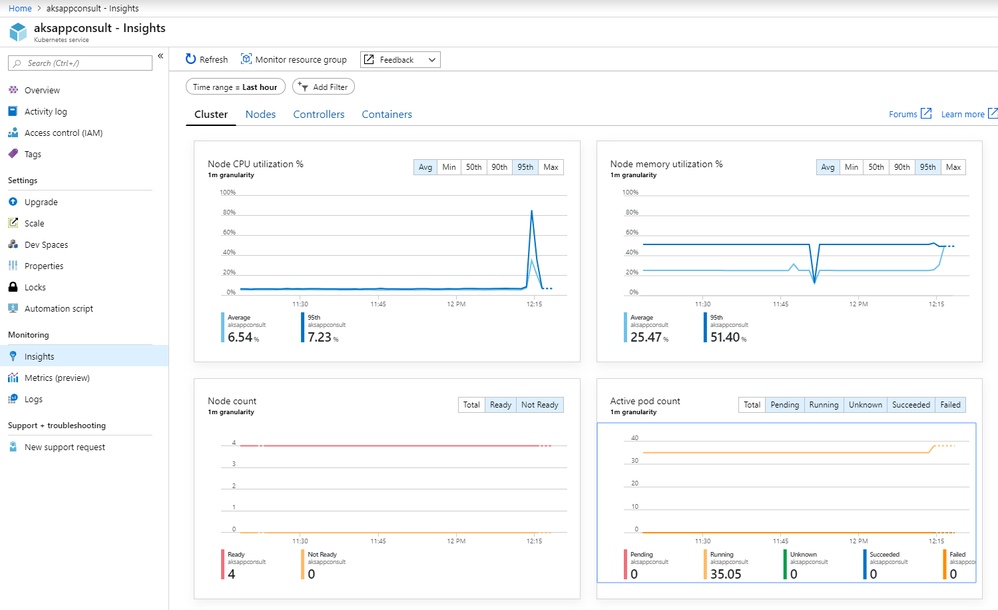
One of the advantages of using AKS instead of an on-premises cluster is that you get, out of the box, lot of insights about its status. It's enough to click, in the dashboard, on the Insights section to see lot of useful metrics:
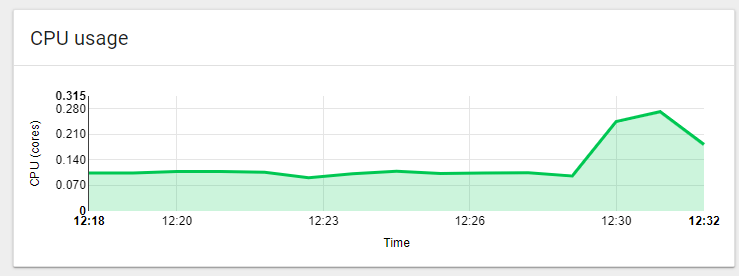
You can quickly see, for example, that we had a spike of CPU usage, which has been translated in a higher number of pods. This happened when we have run the stress test using Loader.io.
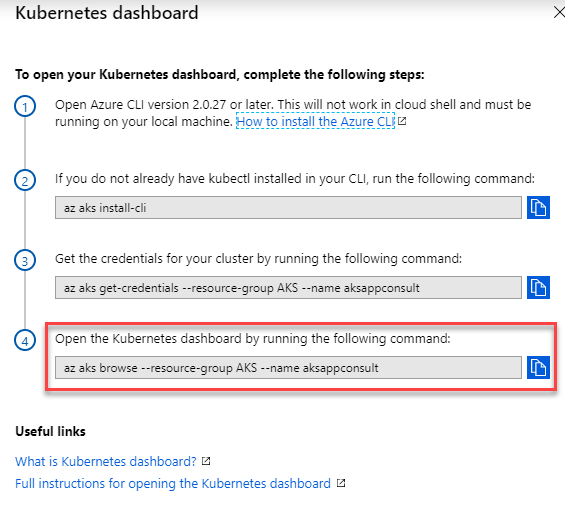
What if you want to use the same Kubernetes dashboard we have used in the previous post on our local machine? Good news, it's already deployed on AKS! In order to see it, just return to the home of your AKS cluster and click on View Kubernetes dashboard. If you remember, we have already used this section to retrieve the 2 commands we needed to setup kubectl to connect to our AKS cluster of the local one. But there's also a third command we didn't use:
This is the exact command we need to see the dashboard. Copy and paste in your command prompt. It will spin up a proxy that will launch the dashboard on your local machine, but with the data coming from your AKS instance.
PS> az aks browse --resource-group AKS --name aksappconsult
Merged "aksappconsult" as current context in C:\Users\mpagani\AppData\Local\Temp\tmpb68eguz8
Proxy running on http://127.0.0.1:8001/
Press CTRL+C to close the tunnel...
Forwarding from [::1]:8001 -> 9090
Forwarding from 127.0.0.1:8001 -> 9090
Handling connection for 8001
Your default browser will automatically be launched on the http://127.0.0.1:8001 URL:
Thanks to the dashboard, you will be able to review all the events that happened during the stress test. For example, click on web in the Deployments section. You will be able to quickly see the CPU spike we had:
If you scroll down you will find a section called Horizontal Pod Autoscalers (HPA), which will list the auto scale definition we have previously set:
In the Events section we can see that we have exceeded all the defined metrics, so auto scaling kicked in:
As a consequence, in the New replica set we can see that we have now 7 pods running for the web deployment:
Wrapping up
In this long post we have seen how, after having learned the basics of Kubernetes in the previous post, it's easy to reuse the same knowledge in a real environment like Azure Kubernetes Service, which is powered by the cloud and, as such, it offers a lot more flexibility. Additionally, thanks to the auto scaling, we can quickly scale up the resources of our application to satisfy any peak load that our application may experience and quickly scale down once the situation is back to normal.
I've updated my sample on Docker to include the Kubernetes YAML file we have created during this blog post.
Happy deploying!

