Having visibility into all your documents and emails in one place is very powerful on its own but how can you make it even better? That’s where this blog post comes in. Today, we want to show you how to combine Microsoft Information Protection (MIP) audit events with sign in activity from Azure Active Directory to produce richer and more interesting reports.
Microsoft Information Protection central reporting helps IT professionals gain greater visibility into sensitive data across the organization. Starting with version 1.41.51.0, the Azure Information Protection (AIP) client can send user activity events to an Azure Log Analytics workspace in your Azure tenant. Of course, the AIP client is not the only way MIP helps you discover sensitive data. The AIP Scanner, Microsoft Defender ATP as well as Microsoft Cloud App Security (MCAS) are other solutions that help provide full visibility into your critical documents across on-premises, user end points as well as SaaS providers.
For more information, read the following blog posts:
- Data discovery, reporting and analytics for all your data with Microsoft Information Protection
- Discover and protect sensitive data through Azure Information Protection and Windows Defender ATP
Prerequisites:
- Azure Information Protection already enabled in your tenant with labels configured and published to a policy
- One of the following AIP clients:
- Version 1.41.51.0 and higher or
- Unified labeling client (currently in preview)
- AIP Analytics configured in the AIP Azure portal
- Integrated Azure AD activity logs with Azure Monitor (Make sure to select the same Log Analytics workspace being used for AIP)
Confirm Setup
With the above requirements out of the way, let’s confirm that your logs are available within Log Analytics before we proceed.
There are several ways to get to your Log Analytics workspace but for now, just find Azure Monitor and click on Logs and you should land on the below view.
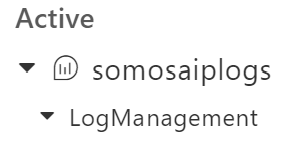
Next, make sure you select your AIP Log Analytics workspace (somosaiplogs in this example) and expand the LogManagement group.
Finally, scroll down until you find SigninLogs as shown below.
Optional: Double click on SigninLogs and run the default query.
Let’s run some reports:
Now that we have both AIP and Azure AD sign in logs in one place, let’s begin by running some simple reports from MIP.
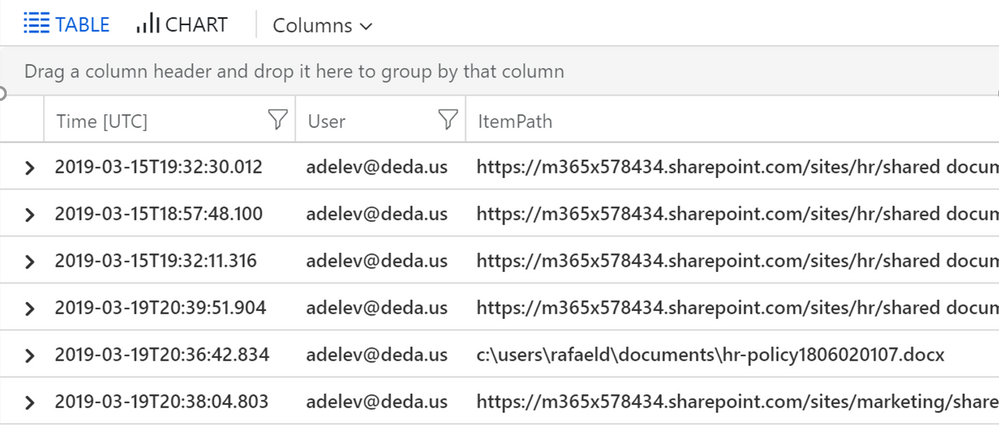
Run the following query to obtain a list of label downgrade activities by a user:
InformationProtectionEvents
| where Time >= ago(30d)
| where Activity == “DowngradeLabel“
| where User == “adelev@deda.us”
This report is a good way to find all the different locations being used by a user given AIP keeps track of the location for each file affected by a user.
TIP: Although not the focus of this post, you can create an alert based on any of the queries you create in Azure Monitor.
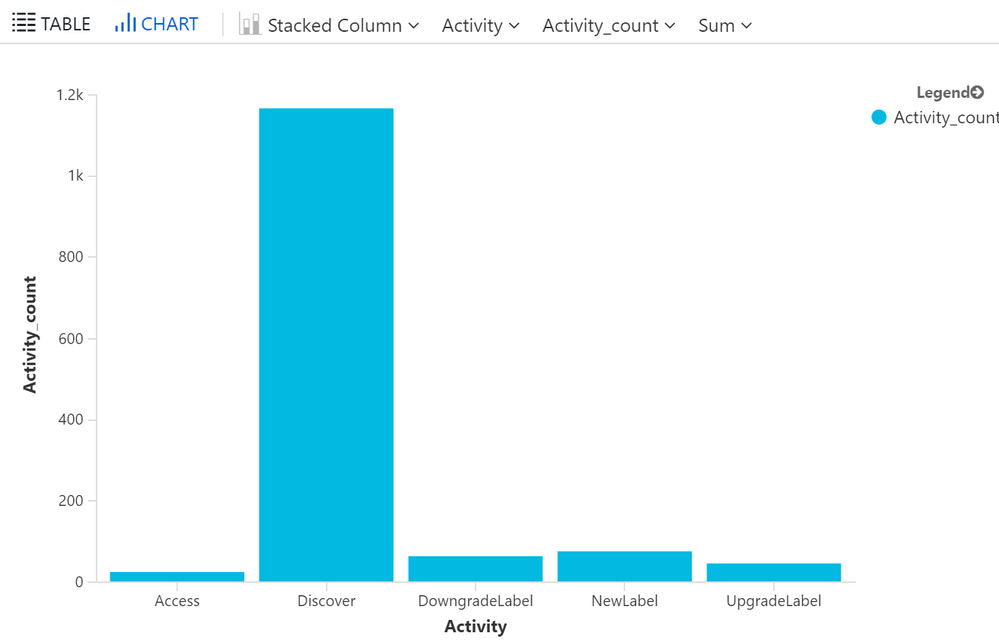
Here is another report that gets rendered in a chart by default:
InformationProtectionEvents
| where Time >= ago(30d)
| where isnotempty(Activity)
| summarize Activity_count=count() by Activity
| sort by Activity asc nulls last
| render columnchart
Another useful report you may want to consider is getting a list of files with a Confidential or Highly Confidential label that are not protected (RMS encrypted). This is helpful when you start implementing protection for some of your data.
Here is a list of files with a label that contains “Confidential” but have no protection.
InformationProtectionEvents
| where LabelName contains “Confidential” and IsProtected == “false”
| summarize dcount(ItemPath) by ItemPath, User, IsProtected, Time, MachineName
| project ItemPath, User, IsProtected, Time, MachineName
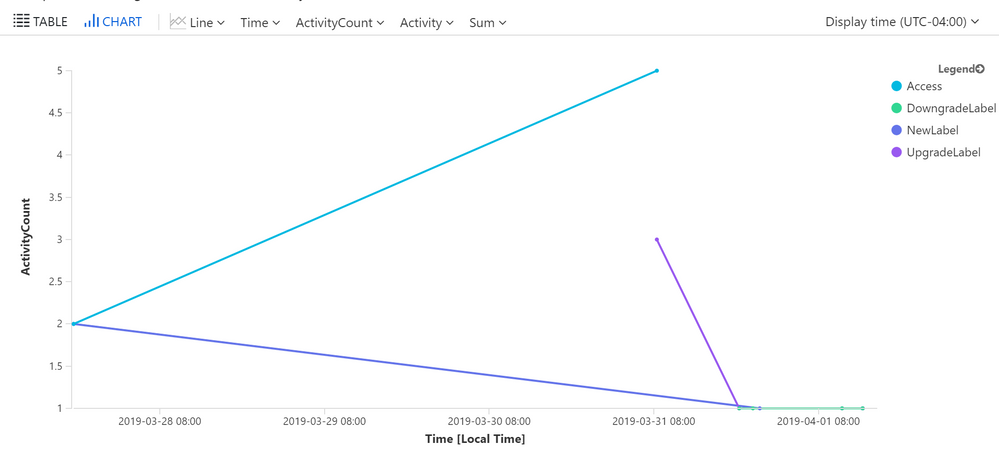
Here we’ll count the number of events by hour to see which hour of the day has the most events.
Note: Excluding the “Discover” activity type is of course optional.
// By Activity trend over time by hour
InformationProtectionEvents
| where Time >= ago(7d)
| where Activity != ‘Discover’
| extend dummy = 1
| summarize ActivityCount=sum(dummy) by (bin(Time, 1h)), Activity
| render timechart
Combined Reports
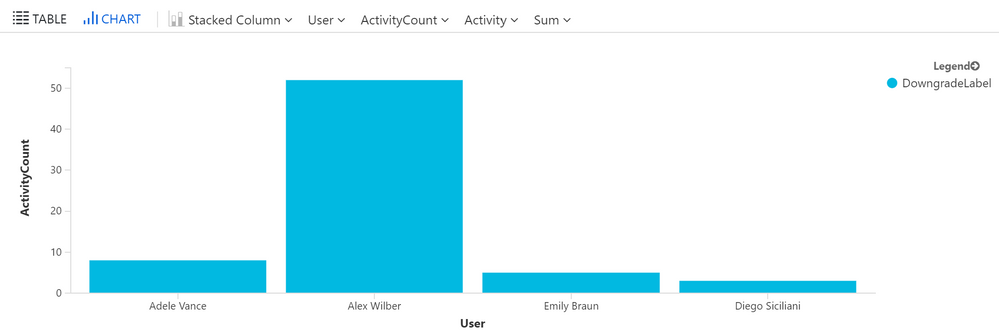
Time to go pro. Let’s run some advanced reports that combine data from both AIP and Azure AD logs. This is the gist of this blog. We want to give you a taste of how you can enhance all the MIP audit events you are already collecting with properties from other data sources. In the example below we want to understand how many label downgrade actions have been performed in a country. This is possible because the sign in activity from Azure AD contains the user Location/Country which was captured during the logon process.
A couple of points on this before we go on. It’s important to keep in mind that location data may or may not be available to you depending on your Azure AD authentication flow. Another important point to remember is that the below examples are just the beginning. You can certainly combine MIP audit events with one or more data sources to create even richer reports.
Let’s start by seeing total activity by user in a single country (Brazil in this case):
let SpecifiedTime = totimespan(31d);
InformationProtectionEvents
| where Time >= ago(SpecifiedTime)
| where Activity == “DowngradeLabel“
| project Activity, Time, User
| extend dummy = 1
| summarize ActivityCount=sum(dummy) by User, Activity
| join kind=inner (
SigninLogs
| where Location == “BR”
| summarize arg_max(TimeGenerated, *) by UserPrincipalName
| project UserPrincipalName , LocationDetails , UserDisplayName
) on $left.User == $right.UserPrincipalName
| project User=UserDisplayName, Activity, ActivityCount, UPN=UserPrincipalName ,Country=todynamic(LocationDetails).countryOrRegion , State=todynamic(LocationDetails).state, City=todynamic(LocationDetails).city
The sign in logs contain other interesting data points like City and State which we leverage on the query below to get more context about the activity for all users.
let SpecifiedTime = totimespan(31d);
InformationProtectionEvents
| where Time >= ago(SpecifiedTime)
| where Activity == “DowngradeLabel“
| project Activity, Time, User
| extend dummy = 1
| summarize ActivityCount=sum(dummy) by User, Activity
| join kind=inner (
SigninLogs
| summarize arg_max(TimeGenerated, *) by UserPrincipalName
| project UserPrincipalName , LocationDetails , UserDisplayName
) on $left.User == $right.UserPrincipalName
| project User=UserDisplayName, Activity, ActivityCount, UPN=UserPrincipalName ,Country=todynamic(LocationDetails).countryOrRegion , State=todynamic(LocationDetails).state, City=todynamic(LocationDetails).city
Here is the result in table format:
And here is the chart view:
Call to action and final thoughts
This was just a quick primer to illustrate some of what’s possible with the rich data set provided by Microsoft Information Protection. If you haven’t already, we encourage you to enable AIP centralized logging with Azure Monitor today or If you already have, start building your favorite reports.
Of course, we realize that most of you have on-premises solutions where you do your log aggregation and reporting. Not to worry. Azure Monitor allows you to stream all logs to the SIEM of your choice. If SIEM in the cloud is your cup of tea, we encourage you check out the recently announced Azure Sentinel where you can run these queries as it uses Azure Monitor.
You may also be interested to know that Azure Monitor allows you to export these queries directly into Power BI as shown here: https://docs.microsoft.com/en-us/azure/azure-monitor/platform/powerbi
Finally, in case you are not familiar, the query language we use above is called Kusto. Below is a great resource to help you get up to speed.
Kusto query overview: https://docs.microsoft.com/en-us/azure/kusto/query/
We hope this has been helpful and we encourage you to give us feedback and share your favorite queries with us and the community.

