This post has been republished via RSS; it originally appeared at: New blog articles in Microsoft Tech Community.
This is the third part of the series of articles to give better overview of Log Analytics used to query Azure SQL DB audit data
- AZURE SQL DB AND LOG ANALYTICS BETTER TOGETHER – PART #1
- AZURE SQL DB AND LOG ANALYTICS BETTER TOGETHER – PART #2 – ALERTS
In this part 3 we will investigate how to query AUDIT data on Log Analytics.
If you want to know how to create a Log Analytics check previous parts
On Azure SQL DB you can have AUDIT data saved to Storage Account, Log Analytics and Event Hub. Log Analytics will be the easiest way to investigate this data
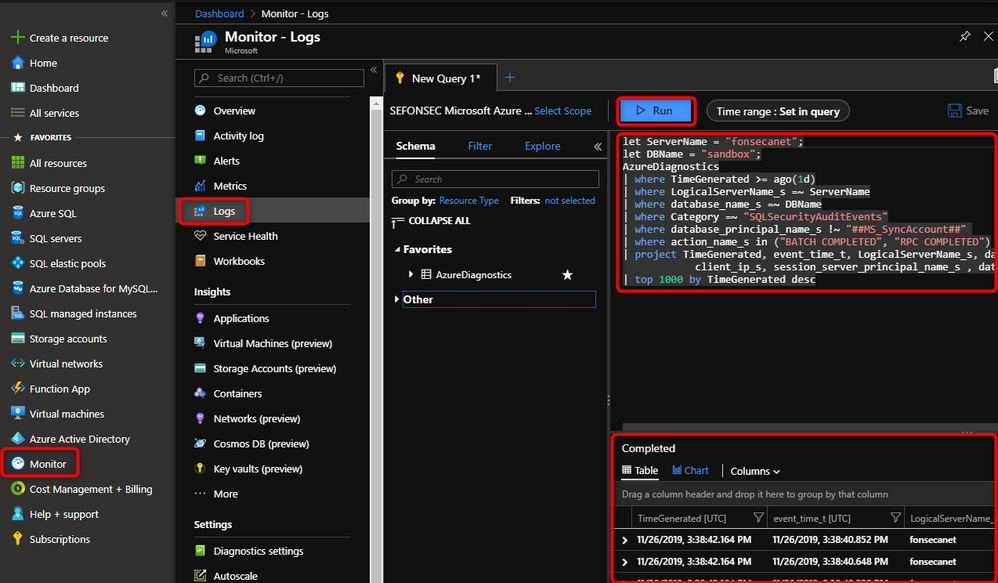
You just need to go to Azure Portal > Monitor > Logs. Write your Kusto query and run it to get data
You can find a sample Kusto query below and find more information regarding Kusto syntax at: https://docs.microsoft.com/en-us/azure/kusto/query/
Some samples of other usage and kind of information that you can get
Filter specific statements texts (Who DROPPED my table, Who deleted ALL rows)
Add below to query sample above
In this case we can find who dropped an object, using what application was used, etc. You can even use the date and time of request a restore to a point in time some seconds, before the delete was committed.
Checking commands that failed
Add filter
We can see that in this case we found and event of failure, we can see error details
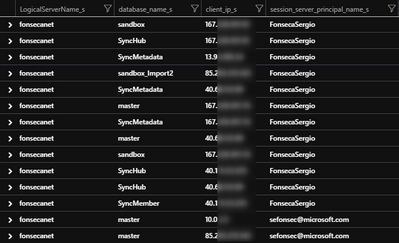
What IPs have connected to my server
With this query you can check if some weird IP have been accessing your database. In this test I commented database to bring all DBs from server
You can also include in the query filter for known IPs to return only sporadic IPs
As you noticed you can easily change this Kusto query to filter other fields to get additional information like commands that some IP have ran or that a specific user or IP have ran.


