This post has been republished via RSS; it originally appeared at: New blog articles in Microsoft Community Hub.
Overview
In the Azure Sphere product team, we hear frequently from our customers that one of the biggest challenges for operating a fleet of devices is being able to remotely monitor and diagnose any issues without having to dispatch a technician. Without the right data and tools for remote diagnostics, troubleshooting a device is costly, and can span weeks at a time. With the integration of Azure Sphere and Azure Monitor enabled by the Public Preview of Azure Portal integration for Azure Sphere, you can now unlock capabilities for seamless monitoring and swift diagnostics of a fleet of Azure Sphere devices. We will share three common scenarios to demonstrate how to use Metrics, Log Analytics, and Alerts as part of the Azure Monitor suite.
1) Correlate device fleet health with key events
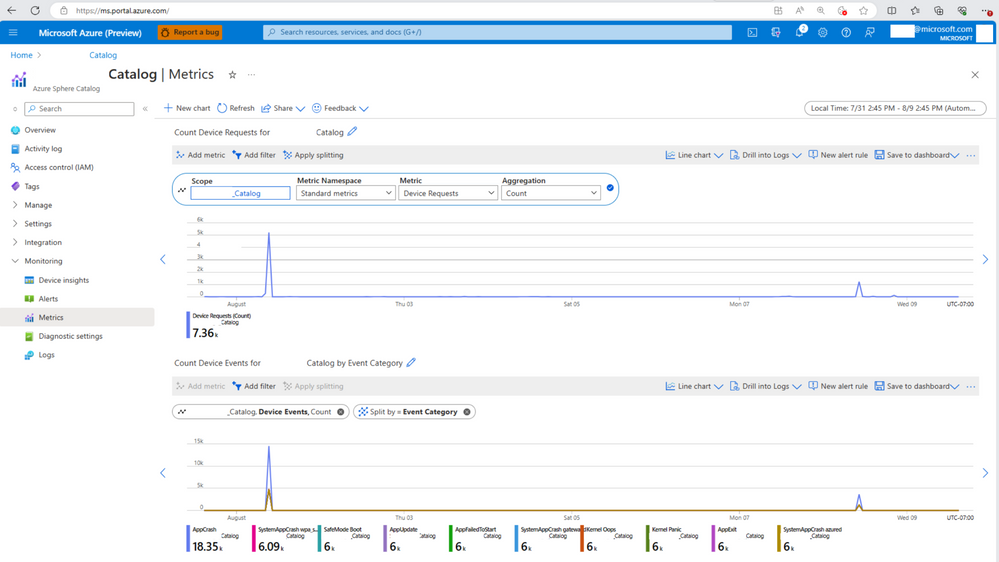
When connectivity with field devices is lost unexpectedly, one of the first questions to ask is: "what changed?" To answer that, you can configure Metrics to show key events such as OS updates, app updates and certificate validity, and add device health metrics on the same timeline for quick correlation. This allows you to focus your investigation on a specific team or area, saving hours to days of developer time and reducing support operations overhead.
Figure 1: Review if device update events (upper chart) and error telemetry (lower chart) are correlated.
2) Review device history
When a device exhibits unexpected behavior, such as rebooting repeatedly, the first step is to review device logs for clues. By configuring a Diagnostic setting, device logs are routed automatically to your endpoint of choice for subsequent review and analysis.
Figure 2: Configure Azure Monitor to send 'Device Events' and 'Audit Logs' to a Log Analytics workspace.
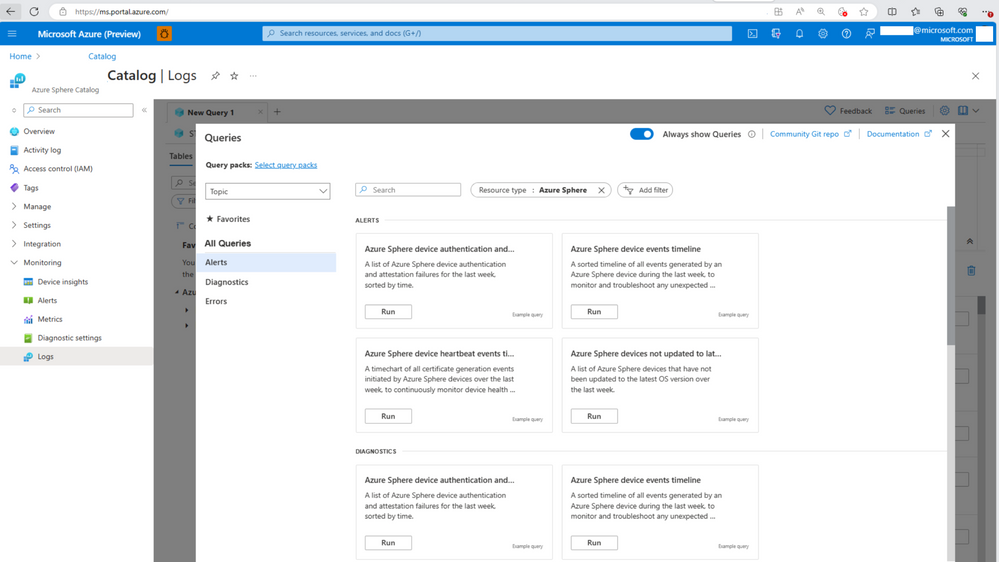
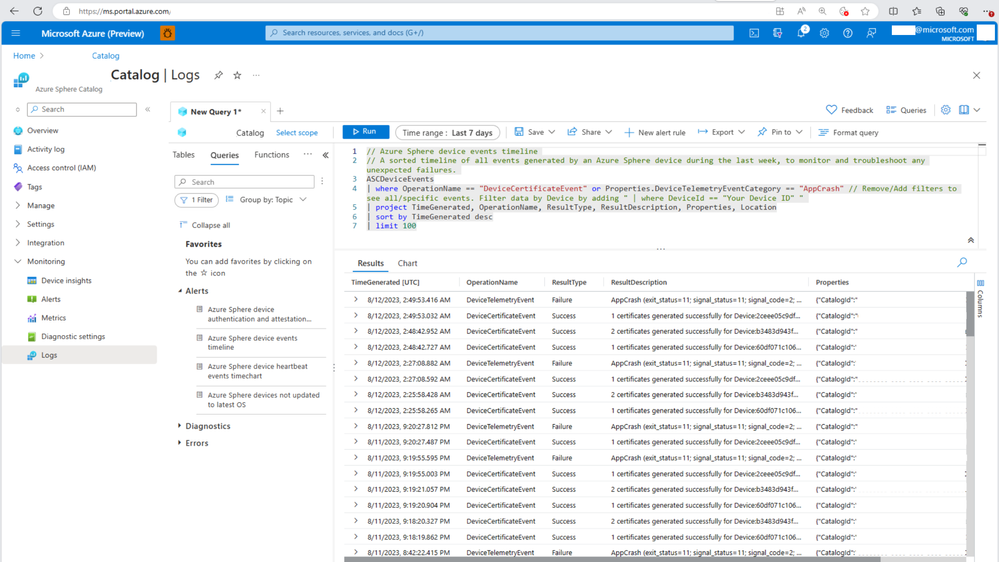
With Log Analytics integration, out-of-the-box KQL queries are provided to help you quickly analyze the state of your fleet and devices. You don’t need to write any code if you choose not to. Simply hit Run to generate curated device health reports.
Figure 3: Get started with Log Analytics quickly by running out-of-the-box queries.
Figure 4: Analyze device history within the past 24 hours with the Azure Sphere device events timeline query.
3) Receive alerts for events of interest
With Alerts, you can be notified for a fleet event or device event based on configurable thresholds. Configurable thresholds can be set on a metric of choice (e.g., number of application crashes within a specified timeframe) or on a Log Analytics query result (e.g., cumulative number of OS update failures). Both examples are shown below.
Figure 5: Create an alert rule to detect application crashes exceeding a threshold of 10 every hour.
Figure 6: Create an alert rule to detect when more than 10 instances of a device update event are not successful within the past 24 hours.
Conclusion
The three scenarios shared demonstrate how you can leverage Azure Sphere’s integration with Azure Monitor to understand the state and health of your device fleet. Metrics provides a bird’s eye view of key events that are happening in the fleet over time. After that, if you want to investigate the events further, Log Analytics allows you to run queries against fleet data. You can also configure automated Alerts that notify you when key events occur. These capabilities provide a good starting point in understanding the state and health of your device fleet. For additional diagnostic guidance, you may refer to best practices for remote troubleshooting of Azure Sphere devices.


