This post has been republished via RSS; it originally appeared at: Microsoft Tech Community - Latest Blogs - .
What is Open telemetry?
Open Telemetry also known as OTel for short, is an open source project that was result of OpenTracing and OpenCensus merging currently hosted by the Cloud Native Computing Foundation(CNCF). Otel is a collection of tools, APIs, and SDKs that works as Observability framework for instrumenting, generating, collecting, and exporting telemetry data such as traces, metrics, logs to help you analyze your software’s performance and behavior.
It offers a industry-standard way by providing the non-language specifications and contracts for generating telemetry data and sending it to the choice of your backend like , Azure Monitor, Elasticsearch etc. for analyzing or processing the telemetry data at high scale.
Open telemetry provides some of the components as part of the "core" distribution, such as the Jaeger and Prometheus components, and other custom components as part of the "contrib" distribution.

A tale of ADX and telemetry data
Azure Data Explorer (ADX), a highly scalable analytics solution designed for structured, semi-structured, and unstructured data, offers customers a dynamic querying environment that extracts information from the vast ocean of expanding log and telemetry data.
As per the GigaOm report, Azure Data Explorer provides superior performance at a significantly lower cost in both single and high-concurrency scenarios. Read full report here.
Here we introduce Open telemetry Azure Data explorer exporter (GitHub). It works as a bridge to ingest data generated by Open telemetry to the ADX clusters by customizing the format of the exported data according to the needs of the end user. Find out more in the documentation.
Setting up our Open telemetry demo application
Opentelemetry provides a demo application named Open Telemetry Astronomy Shop. And we will be using this demo application to setup our ADX exporter to ingest telemetry data right to the ADX clusters.
Before we start, we assume you have installed Docker on your system, else it can be downloaded from here
- Clone the demo application
git clone https://github.com/open-telemetry/opentelemetry-demo.git

cd opentelemetry-demo
- Running Otel with ADX
The demo application comes with a docker-compose.yml file. Which fetches all the docker images, required to run various services of the application. This includes fetching of Otel-contrib docker image. Kindly note that the ADX exporter is available from v0.62.0 or later, so it will be better to change the image tag from otel/opentelemetry-collector-contrib:x.xx.x to otel/opentelemetry-collector-contrib:latest this will always fetch the latest Otel-contrib image.
Before running ADX exporter as backend for Otel data, it is assumed that you have a ADX cluster up and running. and an Azure AD application.
Note: You can start creating a free ADX cluster from here. Creating an Azure AD application and authorizing the same can be followed from here
Now, to run ADX exporter there are a few required configurations that need to be created. Paste the below configurations at
opentelemetry-demo\src\otelcollector\otelcol-config-extras.yml
exporters:
  azuredataexplorer:
    cluster_uri: "https://<some_cluster_uri>.kusto.windows.net"
    # Client Id
    application_id: "xxxx -xxxx-xxxx-xxxxxxxx"
    # The client secret for the client
    application_key: " xxxxxxxxxxxxxxxxxxxx "
    # The tenant
    tenant_id: " xxxx -xxxx-xxxx-xxxxxxxx "
    # database for the logs
    db_name: "<somedatabase>"
    metrics_table_name: "<Metrics-Table-Name>"
    logs_table_name: "<Logs-Table-Name>"
    traces_table_name: "<Traces-Table-Name>"
   ingestion_type : "managed"
service:
  pipelines:
    traces:
      exporters: [azuredataexplorer]
    metrics:
      exporters: [azuredataexplorer]
    logs:
      receivers: [otlp]
      exporters: [ azuredataexplorer]
- In the next step we have to create tables, with the same name that we have mentioned in the config above. Paste below commands to your ADX db, which will create the required tables and with the schema that is synced with the ADX exporter, in case you want to have custom schema a mapping reference will be required, and same need to be mentioned in the config above. Refer ADX exporter’s readme
.create-merge table <Logs-Table-Name> (Timestamp:datetime, ObservedTimestamp:datetime, TraceId:string, SpanId:string, SeverityText:string, SeverityNumber:int, Body:string, ResourceAttributes:dynamic, LogsAttributes:dynamic)

.create-merge table <Metrics-Table-Name> (Timestamp:datetime, MetricName:string, MetricType:string, MetricUnit:string, MetricDescription:string, MetricValue:real, Host:string, ResourceAttributes:dynamic,MetricAttributes:dynamic)

.create-merge table <Traces-Table-Name> (TraceID:string, SpanID:string, ParentID:string, SpanName:string, SpanStatus:string, SpanKind:string, StartTime:datetime, EndTime:datetime, ResourceAttributes:dynamic, TraceAttributes:dynamic, Events:dynamic, Links:dynamic)
- Now you are ready to run the demo application, with OTel collector that has ADX exporter configured as backend. Let's deploy the application by executing
docker compose up
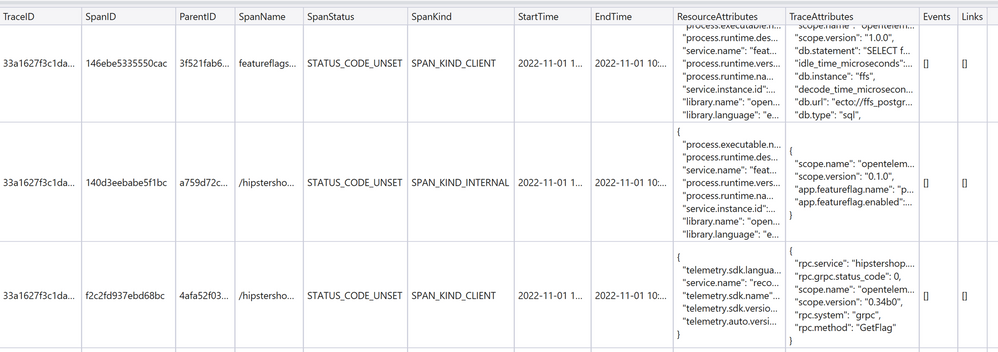
That’s it. Your application is up and running, and you will start getting data in your ADX Cluster.
To fetch latest 100 records from the respective table:
OTELMetrics| order by Timestamp desc
    |take 100

OTELTraces| order by StartTime desc
    | take 100


