This post has been republished via RSS; it originally appeared at: Microsoft Tech Community - Latest Blogs - .
Azure Databricks (ADB) is a powerful spark implementation for data engineering and machine learning. It is extremely powerful when transforming large amounts of data and training massive machine learning models, especially the GPU powered ones. Spark, and Databricks in specific, emits huge amount of telemetry: logs and metrics, when processing massive data volumes.
This telemetry, when ingested in interactive analytics, reporting and exploration platform like Azure Data Explorer (ADX), can enable easy monitoring, investigation and optimization of operations. Maintenance of a coherent history of logs and metrics enables us to run deeper analysis and visualize the series of events when things go wrong. Being able to co-relate between recent data and historical data gives us an ability to investigate and identify potential bottlenecks in Azure Databricks workloads. This in turn can lead to an increase in up time and predictability through timely alerting and reporting, utilizing the Azure Data Explorer's core capabilities.
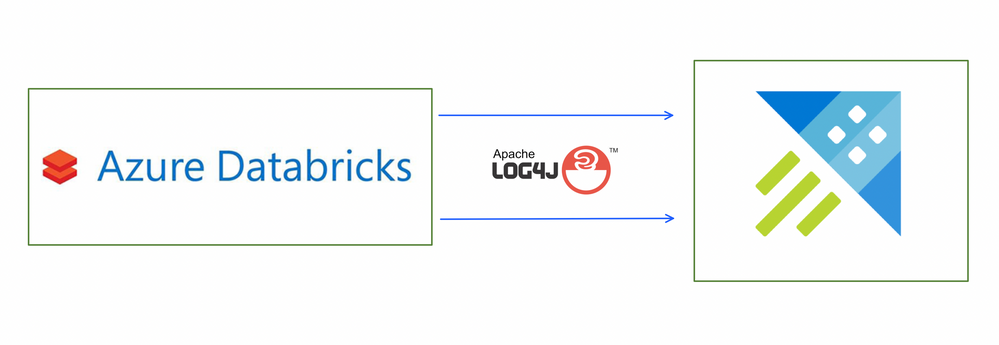
In this blog post, we will walk you through the process of sending Log telemetry of work load execution from Azure Databricks to Azure Data Explorer, via the log4j2-ADX connector. These logs include verbose information of series of events occurring in Azure Databricks during workload execution, including time of event, level of log(warning, error, info, debug), logger name, log message, thread information etc.
Prerequisites:
- Create Azure Data Explorer cluster and database or use an existing one.
- Create an Azure Databricks cluster or use an existing one.
- Create Azure Active Directory App registration and grant it permissions to the database. (Don't forget to save the app key and the application ID for later use in configuration.)
- Create a table in Azure Data Explorer which will be used to store log data. In this example, we have created a table with the name for example, "log4jTest".
.create table log4jTest (timenanos:long,timemillis:long,level:string,threadid:string,threadname:string,threadpriority:int,formattedmessage:string,loggerfqcn:string,loggername:string,marker:string,thrownproxy:string,source:string,contextmap:string,contextstack:string)
- Create a mapping for the table created in Azure Data Explorer. In this example, we have created a csv mapping with the name, "log4jCsvTestMapping".
.create table log4jTest ingestion csv mapping 'log4jCsvTestMapping' '[{"Name":"timenanos","DataType":"","Ordinal":"0","ConstValue":null},{"Name":"timemillis","DataType":"","Ordinal":"1","ConstValue":null},{"Name":"level","DataType":"","Ordinal":"2","ConstValue":null},{"Name":"threadid","DataType":"","Ordinal":"3","ConstValue":null},{"Name":"threadname","DataType":"","Ordinal":"4","ConstValue":null},{"Name":"threadpriority","DataType":"","Ordinal":"5","ConstValue":null},{"Name":"formattedmessage","DataType":"","Ordinal":"6","ConstValue":null},{"Name":"loggerfqcn","DataType":"","Ordinal":"7","ConstValue":null},{"Name":"loggername","DataType":"","Ordinal":"8","ConstValue":null},{"Name":"marker","DataType":"","Ordinal":"9","ConstValue":null},{"Name":"thrownproxy","DataType":"","Ordinal":"10","ConstValue":null},{"Name":"source","DataType":"","Ordinal":"11","ConstValue":null},{"Name":"contextmap","DataType":"","Ordinal":"12","ConstValue":null},{"Name":"contextstack","DataType":"","Ordinal":"13","ConstValue":null}]'
Configure secrets to access Azure Data Explorer
It is recommended to use Databricks secrets to store your credentials and reference them in notebooks and jobs, instead of directly entering them in Azure Databricks notebook. To manage secrets, you can use the Databricks CLI setup & documentation to access the Secrets API 2.0.
There are 2 ways of creating secrets with scope.
For our example we will be using Databricks backed scopes to setup secrets.
- Install pip
curl https://bootstrap.pypa.io/get-pip.py | python3
- Install databricks CLI
pip install databricks-cli
- Generate token in the Databricks UI -> User Settings
- Install token in databricks CLI.
databricks configure --token
- Create scope and add secrets to it.
databricks secrets create-scope --scope adx-secrets --initial-manage-principal users
databricks secrets put --scope adx-secrets --key ADX-INGEST-URL
databricks secrets put --scope adx-secrets --key ADX-APP-ID
databricks secrets put --scope adx-secrets --key ADX-APP-KEY
databricks secrets put --scope adx-secrets --key ADX-TENANT-ID
databricks secrets put --scope adx-secrets --key ADX-DB-NAME
Further details on secrets setup and management can be found here.
Configure ADB cluster init script
If we modify the default log4j2.properties of the driver when the executor is a local configuration, the configuration will be lost at every restart of the cluster. Therefore, in order to preserve the configuration, an init script should be configured.
Details about configuring the databricks cluster init script can be found here.
We will add two sections to the init script, to accomplish the following:
- Install log4j2-ADX connector on the Databricks cluster.
- Configure the connector to send data to ADX, by modifying the log4j2.properties.
Execute the following python script in the Databricks notebook.
dbutils.fs.mkdirs("dbfs:/databricks/scripts/")
Execute the following python script which will download the log4j-kusto connector and add custom appender to the log4j2.properties file in the driver, executor, as well as the master-worker nodes.
# Databricks notebook source
dbutils.fs.put("/databricks/scripts/init-log4j-kusto-logging.sh","""
#!/bin/bash
DB_HOME=/databricks
SPARK_HOME=$DB_HOME/spark

echo "BEGIN: Downloading Kusto log4j library dependencies"
wget --quiet -O /mnt/driver-daemon/jars/azure-kusto-log4j-1.0.1-jar-with-dependencies.jar https://repo1.maven.org/maven2/com/microsoft/azure/kusto/kusto-log4j-appender/1.0.1/kusto-log4j-appender-1.0.1-jar-with-dependencies.jar

echo "BEGIN: Setting log4j2 property files"
cat >>/tmp/log4j2.properties <<EOL
status=debug
name=PropertiesConfig
appender.console.type=Console
appender.console.name=STDOUT
appender.console.layout.type=PatternLayout
appender.console.layout.pattern=%m%n
appender.rolling.type=RollingFile
appender.rolling.name=RollingFile
appender.rolling.fileName=log4j-kusto-active.log
appender.rolling.filePattern=logs/log4j-kusto-%d{MM-dd-yy-HH-mm-ss}-%i.log.gz
appender.rolling.strategy.type=KustoStrategy
appender.rolling.strategy.clusterIngestUrl=$ADX_INGEST_URL
appender.rolling.strategy.appId=$ADX_APP_ID
appender.rolling.strategy.appKey=$ADX_APP_KEY
appender.rolling.strategy.appTenant=$ADX_TENANT_ID
appender.rolling.strategy.dbName=$ADX_DB_NAME
appender.rolling.strategy.tableName=log4jTest
appender.rolling.strategy.logTableMapping=log4jCsvTestMapping
appender.rolling.strategy.flushImmediately=false
appender.rolling.strategy.mappingType=csv
appender.rolling.layout.type=CsvLogEventLayout
appender.rolling.layout.delimiter=,
appender.rolling.layout.quoteMode=ALL
appender.rolling.policies.type=Policies
appender.rolling.policies.time.type=TimeBasedTriggeringPolicy
appender.rolling.policies.time.interval=60
appender.rolling.policies.time.modulate=true
appender.rolling.policies.size.type=SizeBasedTriggeringPolicy
appender.rolling.policies.size.size=1MB
logger.rolling=debug,RollingFile
logger.rolling.name=com
logger.rolling.additivity=false
rootLogger=debug,STDOUT
EOL
echo "END: Setting log4j2 properties files"

log4jDirectories=( "executor" "driver" "master-worker" )
for log4jDirectory in "${log4jDirectories[@]}"
do
	LOG4J2_CONFIG_FILE="$SPARK_HOME/dbconf/log4j/$log4jDirectory/log4j2.properties"
	echo "BEGIN: Updating $LOG4J2_CONFIG_FILE with Kusto appender"
	cp /tmp/log4j2.properties $LOG4J2_CONFIG_FILE
done
echo "END: Update Log4j Kusto logging init"
""", True)

# INIT SCRIPT CONTENT ENDS ----------
Note: Log4j’s configuration parsing gets confused by any extraneous whitespace. Therefore while copying and pasting Log4j settings into the init script, or entering any Log4j configuration in general, be sure to trim any leading and trailing whitespace.
Configure the init script in Azure Databricks cluster
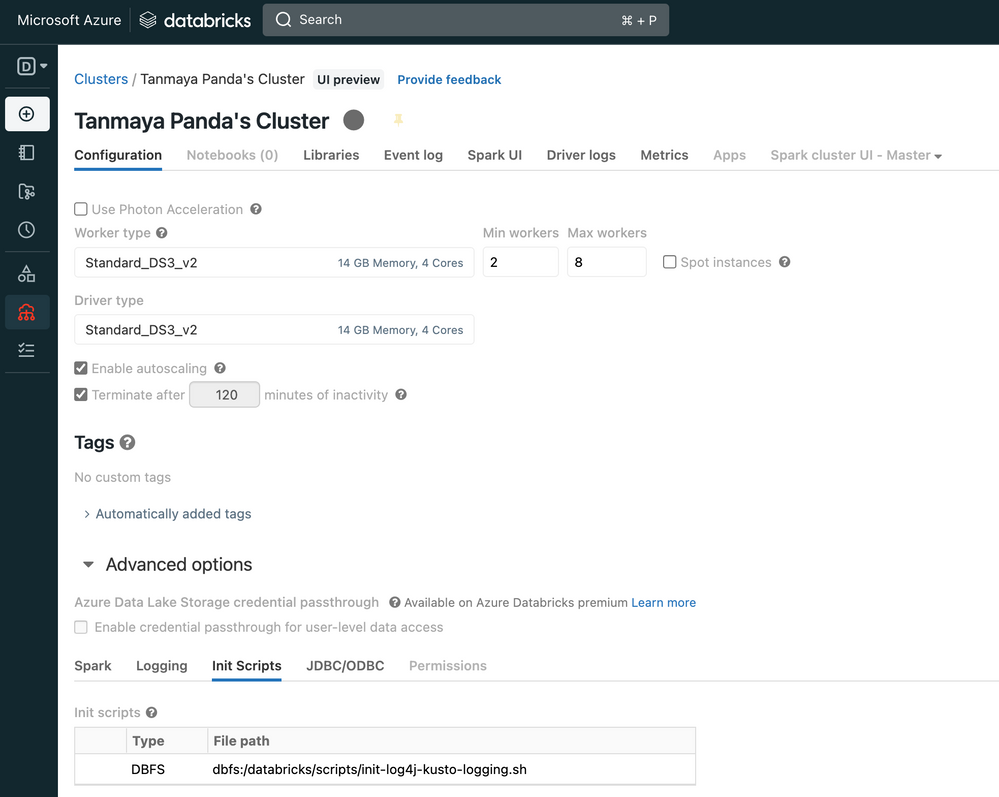
Navigate to the Cluster Configuration -> Advanced Options -> Init Scripts and restart the cluster.
Configure secrets in the Azure Databricks cluster
Navigate to Cluster configuration -> Advanced options -> Spark -> Environment Variables
Add the secret keys as added in databricks CLI.
Send log data to ADX
After the cluster restarts, logs will be automatically pushed to ADX. Application loggers can also be configured to push log data to ADX.
Query and Analyse log data in ADX
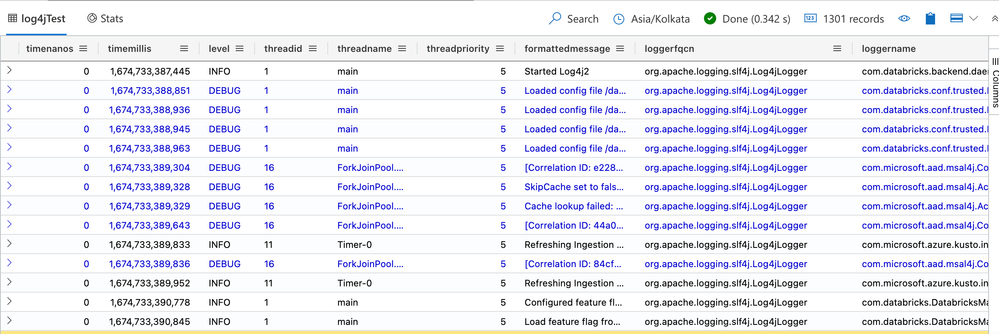
Once the log data starts appearing in the ADX table, as shown in the screenshot below, we can use the powerful KQL (Kusto Query Language) to query and analyze the data.
For example, we may use a query like below to view all log messages with a level of "ERROR":
log4jTest
| where level == "ERROR"
We could also perform analysis, such as finding the top 10 most common error messages, by using the summarize and top operators:
log4JTest
| where level == "ERROR"
| summarize count() by message
| top 10 by count_
Please Note: The init script can also be found under the sample directory of Azure/azure-kusto-log4j (github.com) .
We may further visualize the data in various ways by using the built-in charting capabilities of ADX, such as creating a line chart to show the number of log messages over time. Or, analyze logs to identify usage, error or load trends, or identify anomalies in execution time, by using the built-in Time series analysis functions of ADX.
ADX-PowerAutomate Connector, enables you to orchestrate and schedule flows, and send notifications, and alerts, as part of a scheduled or triggered task. You can set alerts on log events, where if a specific error message appears more than a certain number of times in a given time window we may receive an alert on the desired medium such as an email or teams channel.
In conclusion, by using the log4j2-ADX connector, we can easily ingest log data from Azure Databricks into ADX, giving us the ability to perform powerful data exploration and analysis on Databricks logs. With this setup, we can now easily troubleshoot issues, monitor the performance of our applications, and take action based on the insights.


