
This post has been republished via RSS; it originally appeared at: Microsoft USB Blog articles.
First published on MSDN on Oct 25, 2010Hello, my name is Yang You and I am a program manager for USB Diagnostics. One of the questions we often receive is: How do I use USB for kernel debugging for testing drivers and diagnosing system crashes.
There are several ways to debug Windows. You can use a COM/Serial port, a 1394/Firewire cable, or USB 2.0 debugging cable/port. Although, setting up USB debugging can take a bit more investment and time, USB might be the only externally exposed port that is capable of debugging on certain laptops and netbooks. There are some MSDN topics about: Setting Up a USB 2.0 Debug Cable Connection and Attaching to a Target Computer (Kernel Mode) . The goal of this article is to provide step-by-step instructions about how to set up kernel debugging to use USB 2.0.
Before you Begin…
Make sure that you have the following hardware components.
- A host computer running Windows XP SP3 or a later version of the Windows operating system. Microsoft Windows Debugger (WinDbg), a debugging tool that will run on the host computer.
- A target computer running Windows Vista or a later version of Windows. The target computer has the kernel-mode software you want to debug.
Note : USB 2.0 debugging was introduced in Windows Vista. Later versions of Windows, such as Windows 7 and Windows Server 2008, also support USB debugging.
- A USB 2.0 debug port on the target computer, which implements the optional debug registers.
Note : Not all computers implement the USB debug registers. To determine whether a USB debug port is supported your computer; see Determine the Availability of a USB Debug Port .
- A USB debug cable/device . This is a dedicated USB debugging device with two USB-B ports. A USB debug cable/device requires two USB-A to USB-B cables to connect to the debug computer and target computer. To buy a USB debug cable/device, search for “USB Debug Cable” in your favorite search engine .
- Administrator rights on the host computer and target computer.
Make sure that you have installed,
- USBView on the target computer. Usbview.exe is an application that allows you to browse all USB controllers and the USB devices connected to them. You can install USBView from Install Debugging Tools for Windows package from the SDK. Typically USBView is installed in the C:\Program Files\Debugging Tools for Windows folder.
- Microsoft Windows Debugger ( WinDbg ) on the target computer. WinDbg is a powerful debugger with a graphical interface and a console interface. WinDbg is included with the Windows SDK .
Consider the following limitations,
- Some host controllers on computers do not support a USB debug port or the port might not be available externally. In this case, using USB for debugging might not be an option. Refer to the section below to determine the availability of a USB Debug Port.
- You might not be able to use USB to debug problems early in the boot cycle because USBDBG2.sys has not been loaded. In this case, you must use a different debug option such as Serial or 1394.
Step 1: Find the USB Debug Port
First, identify the USB debug port on the target computer.
To identify the USB debug port, launch USBView on the target computer, plug in a USB device, such as a USB flash drive, and then refresh the list of the ports.
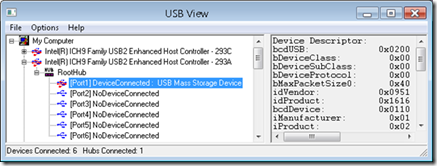
Usually, USBView identifies USB Port 1 as the USB debug port on the USB 2.0 EHCI controller (as shown in the preceding screen grab). However, certain Intel® chipsets expose USB debug on Port 2 instead of Port 1 . For example, the Intel® 5 Series Chipset and Intel® 3400 Series Chipset contain integrated Rate Matching Hubs (RMH). The USB debug ports on those chipsets are the second ports of the integrated RMH.
There are other ways to determine whether the USB debug port is supported; for information on how to do so, see Determine the Availability of a USB Debug Port .
Step 2: Configure the Host Computer
Next, configure your host computer for debugging.
1. Connect a USB debug cable to your USB debug device and connect the other end of the debug cable to a USB port on the host computer.
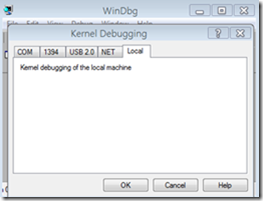
2. Run WinDbg as an administrator and press Ctr+K to open the Kernel Debugging dialog box.
3. Select the USB 2.0 tab and enter a name for the debug target such as “USBDEBUG”. You will use this target name in Step 3.

4. Click OK to return to the main window.

5. If you haven’t already installed the USB debug device driver, it will be installed now. After the driver installs, close WinDBG and repeat steps 1 -4.
Step 3: Configure the Target Computer
Next, set up your target computer on which you identified the USB debug port.
1. Launch Device Manager
2. View the devices by connection ( View -> Devices by Connection )
3. Identify the USB 2.0 host controller (with the USB debug port) under Universal Serial Bus controllers .
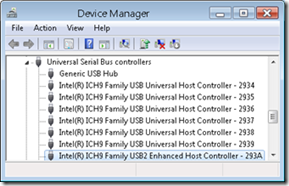

4. View the properties of the USB 2.0 host controller. On the General tab, notice the Location information. Note the PCI device bus, device, and function number; you will need this information later. In the preceding screen grab, Location displays PCI bus 0, device 29, and function 7.
5. Launch a Command Prompt as administrator and run the following commands to enable USB debugging:
1. bcdedit /debug on
2. bcdedit /dbgsettings usb targetname: XXXXX
XXXXX is a string value, such as “USBDEBUG”. For example:
bcdedit /dbgsettings usb targetname:USBDEBUG
3. bcdedit /set {dbgsettings} busparams xx.xx.xx
Where xx.xx.xx is the bus ##.device ##.function ## you previously identified. In Windows Vista, specify HEX values; in Windows 7 specify decimal values. For example:
Windows 7:
bcdedit /set {dbgsettings} busparams 0.29.7
Windows Vista:
bcdedit /set {dbgsettings} busparams 0.1D.7
Step 4: Start Kernel Debugging

- Connect one end of the second USB debug cable to the USB debug device; connect the other end to the USB debug port on the target computer.
- Restart the target computer.
- On the boot menu (if shown), select Windows 7 [debugger enabled] .
On the host computer, you should see USB2: Write Opened in WinDbg after the target computer has started loading Windows.

At this point you can try to hit a breakpoint by pressing Ctrl-Break or clicking the pause button in WinDbg. If you are successful, you should see:

If you were not successful in setting a break point, try to reconnect the USB debug cable on the host computer.
Optional: Determine the Availability of a USB Debug Port
Even though USB debugging is available on most Intel chipsets, it is not available on all computers. The USB debug capability is described in the PCI configuration space of the USB controller, which you can examine in Windbg.
After you have completed Step 3 and Windows has started normally, on the target computer run WinDbg as administrator. Press Ctrl-K to open the Kernel Debugging dialog box, select the Local tab and then click OK .
If you see “Debugger can’t get KD version information, Win32 error 0n5” and the WinDbg closes:
- Open a Command Prompt and run as administrator.
- Navigate to the C:\Program Files\Debugging Tools for Windows directory.
- Run: Kdbgctrl -db
- Run: kdbgctrl -e
- Run WinDbg as administrator and start a local kernel debug session.
Run the following command:
!pci 141 < busID > < deviceID >< functionID >
The last three arguments are the bus id, device id, and function id (in HEX) of the USB 2 Controller identified in Step 3-2. For example, for Bus 0, Device ID 29, and Function ID 7 (in decimal), the command is: !pci 141 0 1d 7

Troubleshooting
- BIOS hand-off might not work and can cause the system to hang when boot with USB debugging is enabled. In this case, try to:
- Disable Legacy USB Support in the BIOS.
- Disconnect the USB debug device from the host computer, restart the target computer, and then reconnect the cable when you see the “Starting Windows” logo on the target computer.
- If the system still hangs, boot in safe mode (press F8 just before Windows loads) and disable debugging using an elevated Command Prompt “bcdedit /debug off”
-
USB Debug does not connect
- Disconnect the USB debug device from the host computer, restart the target computer, and then reconnect the cable when you see the “Starting Windows” logo on the target computer.
-
Certain Intel® chipsets expose USB debug on Port 2 instead of Port 1
.
- For example, the Intel® 5 Series Chipset and Intel® 3400 Series Chipset contain integrated Rate Matching Hubs (RMH). The USB debug ports on those chipsets are the second ports of the integrated RMH.
Conclusion
Congratulations! You should be happily debugging with USB. If you were not successful, check the troubleshooting section for tips. I hope this article was helpful. If you have additional questions, please leave a comment.
Thanks!