Bring your threat intelligence to Azure Sentinel
Introduction
Cyber threat intelligence (CTI) is information describing existing or potential threats to systems and users. This type of information takes many forms, from written reports detailing a particular threat actor’s motivations, infrastructure, and techniques, to specific observations of IP addresses, domains, and file hashes associated with cyber threats. CTI is used by organizations to provide essential context to unusual activity so security personnel can quickly take action to protect their people and assets. CTI can be sourced from many places, such as open source data feeds, threat intelligence sharing communities, paid intelligence feeds, and intelligence gathered in the course of security investigations within an organization.
Within a Security Information and Event Management (SIEM) solution like Azure Sentinel, the most utilized form of CTI is threat indicators, often referred to as Indicators of Compromise or IoCs. Threat indicators are data that associates observations such as URLs, file hashes, or IP addresses with known threat activity such as phishing, botnets, or malware. This form of threat intelligence is often called tactical threat intelligence because it can be applied to security products and automation in large scale to protect and detect potential threats to an organization. In Azure Sentinel, you can use threat indicators to help detect malicious activity observed in your environment and provide context to security investigators to help inform response decisions.
In this blog post, we will cover how to:
- Enable Data connectors to import threat intelligence into Azure Sentinel
- View the threat intelligence you’ve imported in your Logs
- Use the built-in Analytics rule templates to generate security alerts and incidents using your imported threat intelligence
- Visualize key information about your threat intelligence in Azure Sentinel with the Threat Intelligence Workbook
Threat Intelligence also provides useful context within other Azure Sentinel experiences such as Hunting and Notebooks, and while not covered in this article, Ian Hellen has already written a great post Jupyter Notebooks in Sentinel, which covers the use of CTI within Notebooks.
Azure Sentinel data connectors for threat intelligence
Just like all the other event data in Azure Sentinel, threat indicators are imported using data connectors. There are two data connectors in Azure Sentinel provided specifically for threat indicators, Threat Intelligence – TAXII and Threat Intelligence – Platforms. You can use either data connector or both connectors together depending on where your organization sources threat indicators. Let’s talk about each of the data connectors.
Adding threat indicators to Azure Sentinel with the Threat Intelligence – Platforms data connector
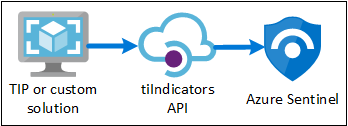
Many organizations utilize threat intelligence platform (TIP) solutions to aggregate threat indicator feeds from a variety of sources, curate the data within the platform, and then choose which threat indicators to apply to various security solutions such as network devices, advanced threat protection solutions, or SIEMs such as Azure Sentinel. If your organization utilizes an integrated TIP solution, such as MISP, Anomali ThreatStream, ThreatConnect, or Palo Alto Networks MineMeld, the Threat Intelligence – Platforms data connector allows you leverage your TIP to import threat indicators into Azure Sentinel. In practice, the Threat Intelligence – Platforms data connector works with the Microsoft Graph Security tiIndicators API to bring threat indicators into Azure Sentinel, so this data connector can also be used by any organization who has a custom threat intelligence platform and wants to leverage the tiIndicators API to send indicators to Azure Sentinel (and other Microsoft security solutions like Defender ATP).
Follow these steps to import threat indicators to Azure Sentinel from your integrated TIP or custom threat intelligence solution:
- Obtain an App ID and Client Secret from your Azure Active Directory
- Input this information into your TIP solution or custom application
- Enable the Threat Intelligence – Platforms data connector in Azure Sentinel
Now let’s take a detailed look at each of these steps.
Obtain an App ID and Client secret from your Azure Active Directory
Whether you are working with a TIP or custom solution, the tiIndicators API requires some basic information to connect and send threat indicators. This information always comes from your Azure Active Directory through a process called App Registration. The three pieces of information you will obtain from this process are:
- Application (client) ID
- Directory (tenant) ID
- Client secret
To register an app with Azure Active Directory:
- Open the Azure portal and navigate to the Azure Active Directory service.
- Select App Registrations from the menu and select New registration.
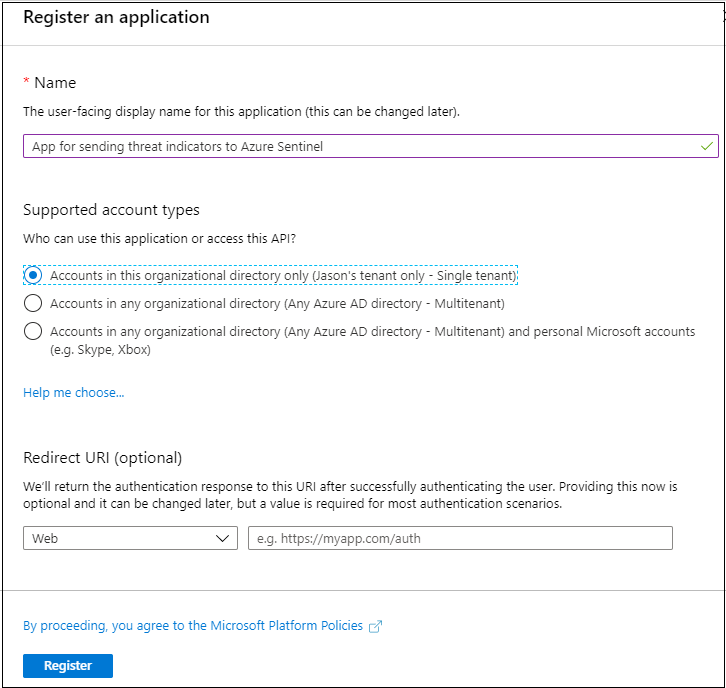
- Choose a name for your application registration, select the Single tenant radio button and select Register.
- Copy the Application (client) ID and Directory (tenant) ID values as these are the first two pieces of information you’ll need later to configure your TIP or custom solution to send threat indicators to Azure Sentinel.
The application is now registered with your Azure Active Directory, but you need to specify the permissions this application requires in order to connect to the Microsoft Graph tiIndicators API and send threat indicators. You will also need to grant consent to this application for these permissions for your organization. To do so, follow these steps:
- Open the Azure portal and navigate to the Azure Active Directory service.
- Select App Registrations from the menu and select your newly registered app.
- Select API Permissions from the menu and click the Add a permission button.
- On the Select an API page select Microsoft Graph to choose from a list of Microsoft Graph permissions.
- When asked what type of permissions does your application require? select Application permissions. This is the type of permissions used by applications authenticating with App ID and App Secrets (API Keys).
- Select ThreatIndicators.ReadWrite.OwnedBy and select Add permissions to add this permission to your app’s list of permissions.
- While the required permission has now been added to the app, your organization must grant consent to this application. To grant consent, you need an Azure Active Directory Global Administrator to select the Grant admin consent for your tenant button on your app’s API permissions page. If you do not have the Global Administrator role on your account, this button will be disabled and you will need to ask a Global Administrator from your organization to perform this step.
- Once consent has been granted to your app, you should see a green check mark under Status.
Now that your app has been registered and permissions have been granted, the last thing you’ll need is to obtain a client secret for your app.
- Open the Azure portal and navigate to the Azure Active Directory service.
- Select App Registrations from the menu and select your newly registered app.
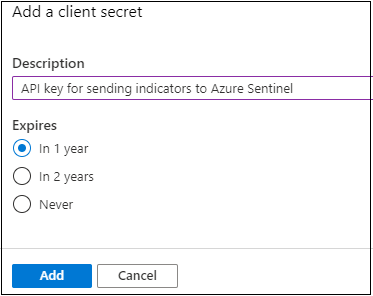
- Select Certificates & secrets from the menu and click the New client secret button to obtain a secret (API key) for your app.
- Click the Add button and be sure to copy the client secret as you cannot retrieve this secret again if you navigate away from this page. You will need this value when you configure your TIP or custom solution.
Input this information into your TIP solution or custom application
You now have all three pieces of information you need to configure your TIP or custom solution to send threat indicators to Azure Sentinel.
- Application (client) ID
- Directory (tenant) ID
- Client secret
Input these values in your integrated TIP or custom solution and threat indicators will be sent via the Microsoft Graph tiIndicators API targeted at Azure Sentinel.
Enable the Threat Intelligence – Platforms data connector in Azure Sentinel
The last thing you need to do is enable the Threat Intelligence – Platforms data connector in Azure Sentinel. This is the step that imports the threat indicators sent from your TIP or custom solution via the Microsoft Graph tiIndicators API into Azure Sentinel. These indicators will be available to all Azure Sentinel workspaces for your organization. Follow these steps to enable the Threat Intelligence – Platforms data connector for each workspace:
- Open the Azure portal and navigate to the Azure Sentinel service.
- Choose the workspace where you want to import your threat indicators sent from your TIP or custom solution.
- Select Data connectors from the menu, select Threat Intelligence – Platforms, and click the Open connector page button.
- As you’ve already completed the app registration and configured your TIP or custom solution to send threat indicators, the only step left is to click the Connect button.
Within a few minutes threat indicators should begin flowing into this Azure Sentinel workspace.
Adding threat indicators to Azure Sentinel with the Threat Intelligence – TAXII data connector
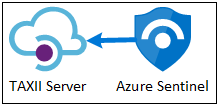
The most widely adopted industry standard for the transmission of threat intelligence is a data format known as STIX and a protocol known as TAXII. If your organization obtains threat indicators from solutions supporting the current STIX/TAXII version 2.0 or 2.1, you can use the Threat Intelligence – TAXII data connector to bring your threat indicators into Azure Sentinel. The Threat Intelligence – TAXII data connector enables a built-in TAXII client in Azure Sentinel to import threat intelligence from TAXII 2.x servers.
Follow these steps to import STIX formatted threat indicators to Azure Sentinel from a TAXII server:
- Obtain the TAXII server API Root and Collection ID
- Enable the Threat Intelligence – TAXII data connector in Azure Sentinel
Now let’s take a detailed look at each of these steps.
Obtain the TAXII server API Root and Collection ID
TAXII 2.x servers advertise API Roots, which are URLs that host Collections of threat intelligence. Most often the API Root can be obtained via the documentation page of the threat intelligence provider hosting the TAXII server. However, sometimes the only information advertised is a URL known as a Discovery Endpoint. If this is the case, it is easy to find the API Root using the Discovery Endpoint. If you already know the TAXII server API Root and Collection IDs you want to work with, feel free to skip to the next section, Enable the Threat Intelligence – TAXII data connector in Azure Sentinel.
Let’s look at an actual example of how to use a simple command line utility called Client URL, which is provided in Windows and most Linux distributions, to discover the API Root and browse the Collections of a TAXII server starting only from the discovery endpoint. For this example, we’ll use the discovery endpoint of the Anomali Limo ThreatStream TAXII 2.0 server (https://limo.anomali.com/taxii).
- From a browser, navigate to the ThreatStream TAXII 2.0 server discovery endpoint (https://limo.anomali.com/taxii) to retrieve the API Root.
{
“api_roots”:
[
“https://limo.anomali.com/api/v1/taxii2/feeds/”,
“https://limo.anomali.com/api/v1/taxii2/trusted_circles/”,
“https://limo.anomali.com/api/v1/taxii2/search_filters/”
],
“contact”: “info@anomali.com”,
“default”: “https://limo.anomali.com/api/v1/taxii2/feeds/”,
“description”: “TAXII 2.0 Server (guest)”,
“title”: “ThreatStream Taxii 2.0 Server”
} - Use the curl utility and the API Root (https://limo.anomali.com/api/v1/taxii2/feeds/) from the previous step to browse the list of Collection IDs hosted on the API Root.
curl -u guest https://limo.anomali.com/api/v1/taxii2/feeds/collections/
{
“collections”:
[
{
“can_read”: true,
“can_write”: false,
“description”: “”,
“id”: “107”,
“title”: “Phish Tank”
},
{
“can_read”: true,
“can_write”: false,
“description”: “”,
“id”: “135”,
“title”: “Abuse.ch Ransomware IPs”
},
{
“can_read”: true,
“can_write”: false,
“description”: “”,
“id”: “136”,
“title”: “Abuse.ch Ransomware Domains”
},
{
“can_read”: true,
“can_write”: false,
“description”: “”,
“id”: “150”,
“title”: “DShield Scanning IPs”
},
{
“can_read”: true,
“can_write”: false,
“description”: “”,
“id”: “200”,
“title”: “Malware Domain List – Hotlist”
},
{
“can_read”: true,
“can_write”: false,
“description”: “”,
“id”: “209”,
“title”: “Blutmagie TOR Nodes”
},
{
“can_read”: true,
“can_write”: false,
“description”: “”,
“id”: “31”,
“title”: “Emerging Threats C&C Server”
},
{
“can_read”: true,
“can_write”: false,
“description”: “”,
“id”: “33”,
“title”: “Lehigh Malwaredomains”
},
{
“can_read”: true,
“can_write”: false,
“description”: “”,
“id”: “41”,
“title”: “CyberCrime”
},
{
“can_read”: true,
“can_write”: false,
“description”: “”,
“id”: “68”,
“title”: “Emerging Threats – Compromised”
}
]
}
You now have all the information you need to connect Azure Sentinel to one or more TAXII server Collections provided by Anomali Limo.
API Root | https://limo.anomali.com/api/v1/taxii2/feeds/ |
Phish Tank | 107 |
Abuse.ch Ransomware IPs | 135 |
Abuse.ch Ransomware Domains | 136 |
DShield Scanning IPs | 150 |
Malware Domain List – Hotlist | 200 |
Blutmagie TOR Nodes | 209 |
Emerging Threats C&C Server | 31 |
Lehigh Malwaredomains | 33 |
CyberCrime | 41 |
Emerging Threats – Compromised | 68 |
Enable the Threat Intelligence – TAXII data connector in Azure Sentinel
To import threat indicators into Azure Sentinel from a TAXII server follow these steps:
- Open the Azure portal and navigate to the Azure Sentinel service.
- Choose the workspace where you want to import threat indicators from the TAXII server.
- Select Data connectors from the menu, select Threat Intelligence – TAXII, and click the Open connector page button.
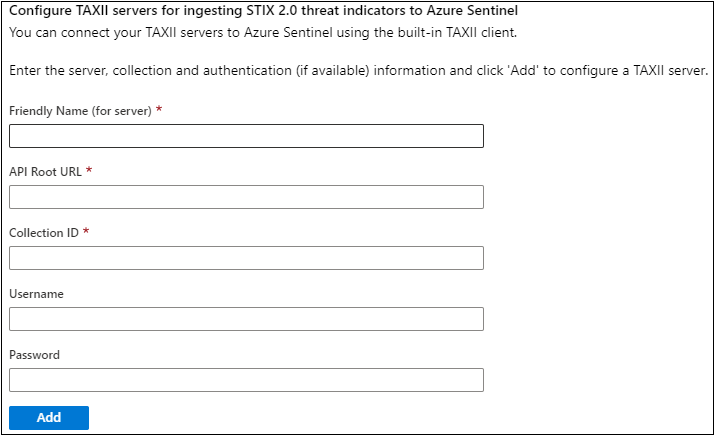
- Type a name for this TAXII server Collection, API Root URL, Collection ID, Username (if required), and Password (if required), and click the Add button.
You should receive confirmation that a connection to the TAXII server was established successfully, and you may repeat step (4) above as many times as desired to connect to multiple Collections from the same or different TAXII servers.
View your threat indicators in Azure Sentinel
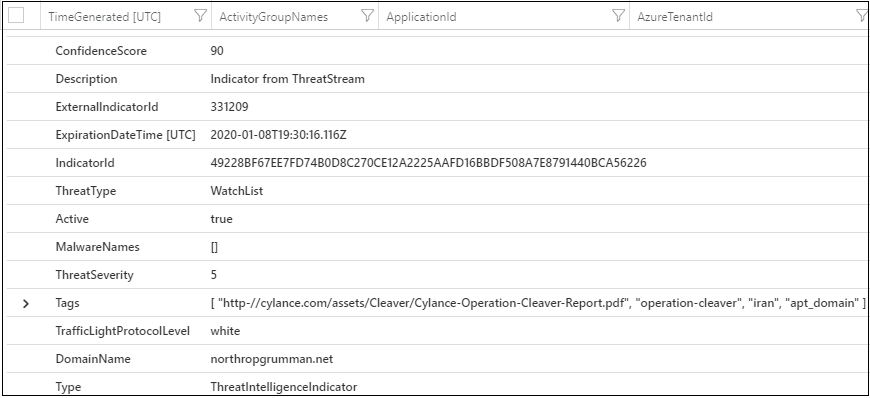
Now that you’ve successfully imported threat indicators into Azure Sentinel using either the Threat Intelligence – Platforms and/or the Threat Intelligence – TAXII data connector, you can view them in the ThreatIntelligenceIndicator table in Logs which is where all your Azure Sentinel event data is stored. This table will be referenced later in this post when we talk about using your threat indicators in other Azure Sentinel features such as Analytics and Workbooks. Let’s look at how to view your threat indicators in the ThreatIntelligenceIndicator table.
- Open the Azure portal and navigate to the Azure Sentinel service.
- Choose the workspace where you’ve imported threat indicators using either threat intelligence data connector.
- Select Logs from the General section of Azure Sentinel.
- The ThreatIntelligenceIndicator table is located under the SecurityInsights group.
- Select the sample query icon next to the table name and select the Run button to execute a query which will show records from this table.
Your results should look similar to the example threat indicator shown below
Analytics put your threat indicators to work detecting potential threats
You’ve done all the work to get threat indicators into Azure Sentinel so now let’s see how you put them to work. The most important use case for threat indicators in SIEM solutions like Azure Sentinel is to power analytics which match your raw events with threat indicators to produce security alerts. In Azure Sentinel Analytics, you create analytics rules that trigger on a scheduled basis and generate security alerts. The rules are expressed as queries, along with configurations that determine how often the rule should run, what kind of query results should generate security alerts, and any automated responses to trigger when alerts are generated.
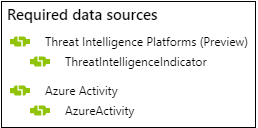
You can always create new analytics rules from scratch, but Azure Sentinel also provides a set of built-in rule templates created by Microsoft which you can use as-is or you can modify to meet your needs. The set of analytics rule templates used to match your threat indicators with your event data are all titled beginning with, ‘TI map…’. All these rule templates operate similarly with the only difference being which type of threat indicators are used (domain, email, file hash, IP address, or URL) and which event type to match against. Each template lists the required data sources needed for the rule to function so you can see at a glance if you have the necessary events already imported in Azure Sentinel.
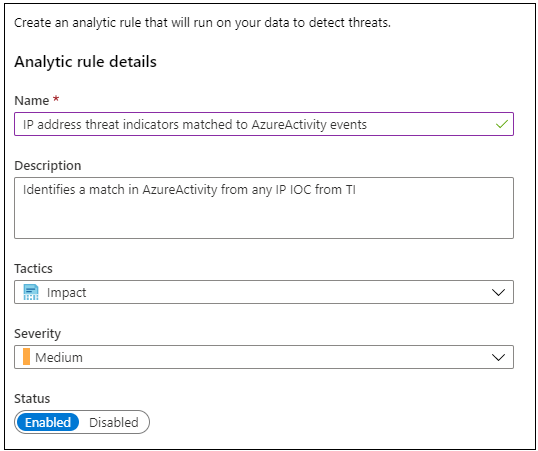
Let’s take a look at one of these rule templates and walk through how to enable and configure the rule to generate security alerts using the threat indicators you’ve imported into Azure Sentinel. For this example, we’ll use the rule template called, TI map IP entity to AzureActivity. This rule will match any IP address type threat indicator with all your Azure Activity events. When a match is found, a security alert will be generated, as well as a corresponding Incident for investigation by your security operations team. This example presumes you have used one or both the Threat Intelligence data connectors to import threat indicators and the Azure Activity data connector to import your Azure subscription level events, as both data types are needed for this analytics rule to operate successfully.
- Open the Azure portal and navigate to the Azure Sentinel service.
- Choose the workspace where you imported threat indicators using the threat intelligence data connectors and imported Azure activity data using the Azure Activity data connector.
- Select Analytics from the Configuration section of the menu.
- Select the Rule templates tab to see the list of available analytics rule templates.
- Navigate to the rule titled, TI map IP entity to AzureActivity and ensure you have connected all the required data sources as shown below.
- Select this rule and select the Create rule button. This opens a wizard to configure the rule. Complete the settings here and select the Next: Set rule logic > button.
- The rule logic portion of the wizard contains the query which will be used in the rule, performs entity mapping which tells Azure Sentinel how to recognize entities like Accounts, IP addresses, and URL so experiences like Incidents and Investigations understand how to work with the data in any security alerts generated by this rule, configures the schedule to run this rule, and the number of query results needed before a security alert is generated. The default settings in the template are:
- Run once an hour
- Match any IP address threat indicators from the ThreatIntelligenceIndicator table with any IP address found in the last one hour of events from the AzureActivity table
- Generate a security alert if the query results are greater than zero, meaning if any matches are found
You can leave the default settings or change any of these to meet your requirements. When you are finished select the Next : Automated response > button
- This step of the wizard allows you to configure any automation you’d like to trigger when a security alert is generated from this analytic rule. Automation in Azure Sentinel is done using Playbooks, powered by Azure Logic Apps. To learn more, see this Tutorial: Set up automated threat responses in Azure Sentinel. For this example, we will just select the Next : Review > button to continue.
- This last step validates the settings in your rule. When you are ready to enable the rule, select the Create button and you are finished.
Now that you have enabled your analytic rule, you can find your enabled rule in the Active rules tab of the Analytics section of Azure Sentinel. You can edit, enable, disable, duplicate or delete the active rule from here. Your newly activated rule triggers immediately when created, and then will trigger on the regular schedule going forward.
If left with the default settings as we did in this example, each time the rule is triggered on its schedule, any results found will generate a security alert. Security alerts in Azure Sentinel can be viewed within Logs section of Azure Sentinel, in the SecurityAlert table under the SecurityInsights group.
In Azure Sentinel the security alerts generated from analytics rules like the one we just enabled also generate security incidents which can be found in Incidents under Threat Management on the Azure Sentinel menu. Incidents are what your security operations teams will triage and investigate to determine the appropriate response actions. You can find detailed information in this Tutorial: Investigate incidents with Azure Sentinel.
Workbooks provide insights about your threat intelligence
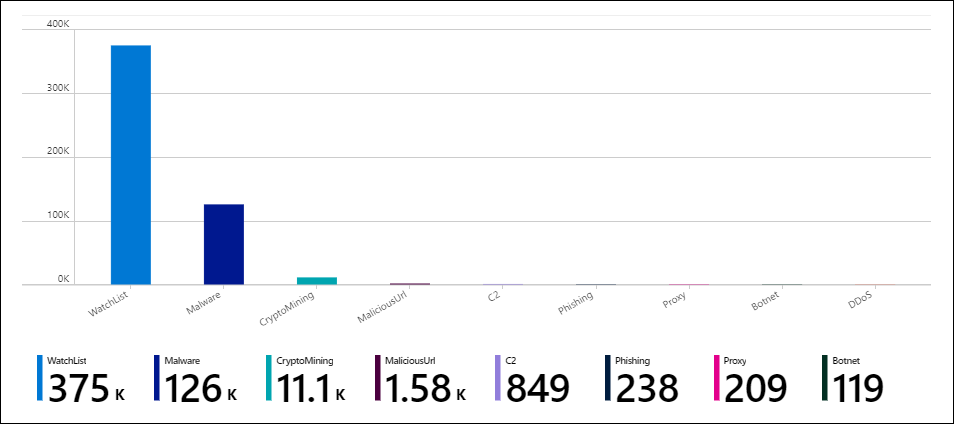
Finally, you can use an Azure Sentinel Workbook to visualize key information about your threat intelligence in Azure Sentinel, and you can easily customize the workbooks according to your business needs.
Let’s walk through how to find the threat intelligence workbook provided in Azure Sentinel, and we will also show how to make edits to the workbook to customize it.
- Open the Azure portal and navigate to the Azure Sentinel service.
- Choose the workspace where you’ve imported threat indicators using either threat intelligence data connector.
- Select Workbooks from the Threat management section of the menu.
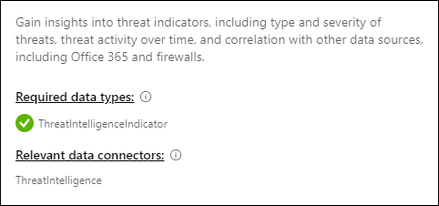
- Navigate to the workbook titled, Threat Intelligence and ensure you have data in the ThreatIntelligenceIndicator table as shown below.
- Select the Save button and choose an Azure location to store the workbook. This step is required if you are going to modify the workbook in any way and save your changes.
- Now select the View saved workbook button to open the workbook for viewing and editing.
- You should now see the default charts provided by the template. Now let’s make some changes to one of the charts. Select the Edit button at the top of the page to enter editing mode for the workbook.
- Let’s add a new chart of threat indicators by threat type. Scroll to the bottom of the page and select Add Query.
- Add the following text to the Log Analytics workspace Log Query text box
| summarize count() by ThreatType
- In the Visualization drop down select Bar chart
- Select the Done editing button and just like that you’ve created a new chart for your workbook.
Workbooks provide powerful interactive dashboards to give you insights into all aspects of Azure Sentinel. There is a whole lot you can do with workbooks and while the provided templates are a great starting point, you will likely want to dive in and customize these templates or created new dashboards combining many different data sources and visualize your data in unique ways. Since Azure Sentinel workbooks are based off Azure Monitor workbooks, there is already extensive documentation and templates available. A great place to start is this article on how to Create interactive reports with Azure Monitor workbooks.
There is also a rich community of Azure Monitor workbooks on GitHub where you can download additional templates and contribute your own templates.
Conclusion
Hopefully, this article has helped you start exploring the threat intelligence capabilities within Azure Sentinel. Over the coming months, you will see additional threat intelligence features added to Azure Sentinel as we continue to invest in this important area of the product. We are also actively working with partners like threat intelligence data providers to bring new experiences and capabilities powered by partners you already know and trust.
I encourage you to visit Azure Sentinel on GitHub where contributions are being made daily by both the community at large and by Microsoft. Here, you’ll find new ideas, templates, and conversations about all the feature areas of Azure Sentinel.

