This post has been republished via RSS; it originally appeared at: Networking Blog articles.
Network connectivity issues are often hard to diagnose. There are multiple machines involved in a single data transfer; at least two endpoints and a complex network infrastructure in the middle. Lately, with the introduction of network virtualization, more of the infrastructure capabilities like routing and switching are being integrated into the endpoints. The additional complexity in the endpoints often leads to connectivity issues that are hard to diagnose. This new infrastructure requires a more comprehensive network diagnostics approach.
Packet Monitor
Packet Monitor (PacketMon) is an in-box cross-component network diagnostics tool for Windows. It can be used for packet capture, packet drop detection, packet filtering and counting. The tool is especially helpful in virtualization scenarios like container networking, SDN, etc. It is available in-box via pktmon.exe command, and via Windows Admin Center extensions.
Overview
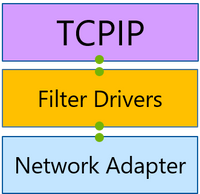
Any machine that communicates over the network has at least one network adapter. All the components between this adapter and an application form a networking stack. The networking stack is a set of networking components that process and move networking traffic. In traditional scenarios, the networking stack is small, and all the packet routing and switching happens in external devices.

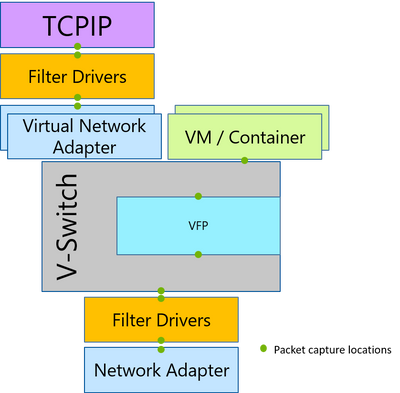
However, with the advent of network virtualization, the size of the networking stack has multiplied. This extended networking stack now includes components, like the Virtual Switch, that handle packet processing and switching. Such flexible environment allows for much better resource utilization and security isolation, but it also leaves more room for configuration mistakes that are hard to diagnose. Accordingly, a visibility within the networking stack is needed to pinpoint these mistakes, and PacketMon provides that visibility.

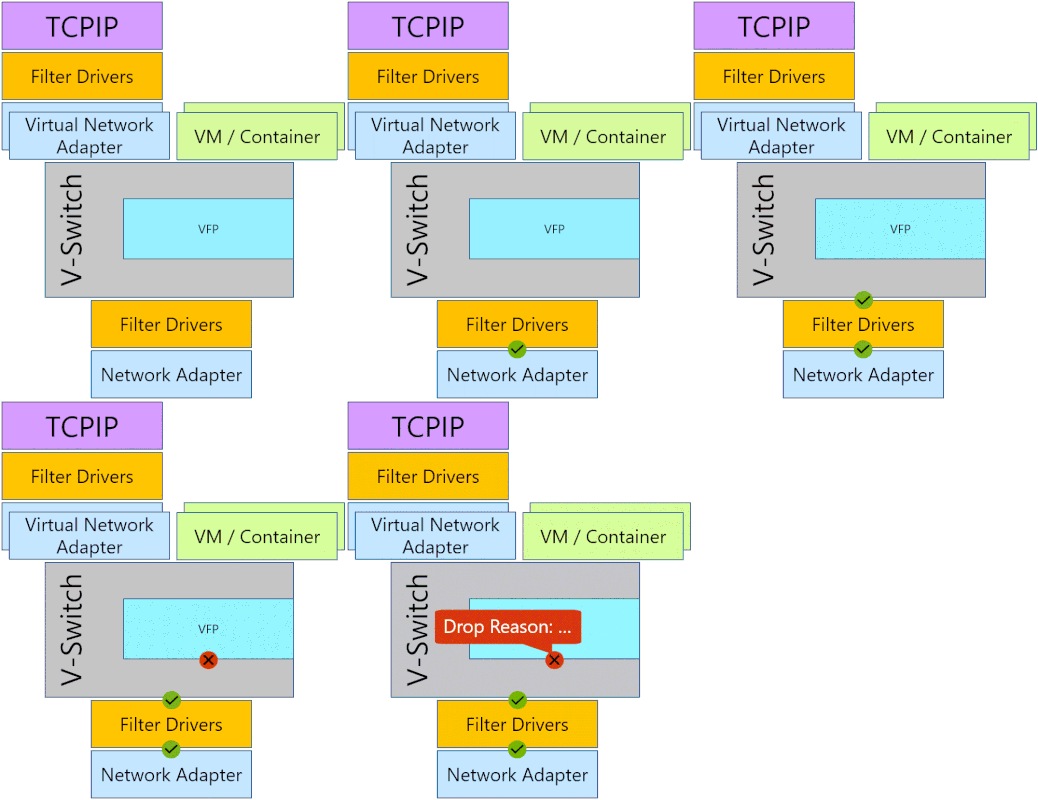
Packetmon intercepts packets at multiple locations throughout the networking stack, exposing the packet route. If a packet was dropped by a supported component in the networking stack, PacketMon will report that packet drop. This allows users to differentiate between a component that is the intended destination for a packet and a component that is interfering with a packet. Additionally, PacketMon will report drop reasons; for example, MTU Mistmatch, or Filtered VLAN, etc. These drop reasons provide the root cause of the issue without the need to exhaust all the possibilities. PacketMon also provides packet counters for each intercept point to allow a high-level packet flow examination without the need for time-consuming log analysis.

Functionality:
Packetmon was first released in Windows 10 and Windows Server 2019 version 1809 (October 2018 update). Since then, its functionality has been evolving through Windows releases. Below are some of the main capabilities and limitations of PacketMon in Windows 10 and Windows Server 2019 version 2004 (May 2020 Update).
Capabilities:
- Packet capture at multiple locations of the networking stack
- Packet drop detection, including drop reason reporting
- Runtime packet filtering with encapsulation support
- Flexible packet counters
- Real-time on-screen packet monitoring
- High volume in-memory logging
- Microsoft Network Monitor (NetMon) and Wireshark (pcapng) compatibility
Limitations:
-
Supports Ethernet only
-
No Firewall integration
-
Drop reporting is only available for supported components
Summary
Packet Monitor is an in-box network diagnostics tool. It fills a gap in diagnosing virtual environments by providing visibility within the networking stack as it captures packets throughout the networking stack and reports packet drops. In subsequent posts, we will explore how to get started with PacketMon, and how to use it to diagnose specific scenarios.

How to access it ? I can’t find this inbuilt option in my OS.
It is a command line tool for logging data. You can open a command prompt then enter pktmon help to see a list of command arguments. The logs have to be analyzed with other tools (even Notepad).
This is a useful guide:
https://www.helpmegeek.com/windows-10-packet-sniffer-pktmon-guide/