First published on MSDN on Oct 24, 2017
Here are common steps I use during troubleshooting performance issues in the Application Insights portal :
Log into portal.azure.com
Navigate to your Application Insight instance
In the overview tab, click on the
Search
button as shown below
Click on the
Time range
button and select a time range that is closer to the perf issue
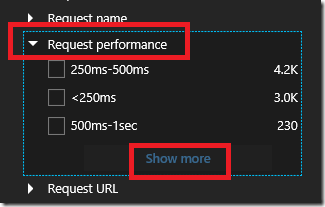
Now click on the Filters button
In the filters blade, look for
Request Performance
and click on the
Show More
Select the long running requests as shown below and click on
Done
button
Now you should see only long running requests. Click on one of the long running requests
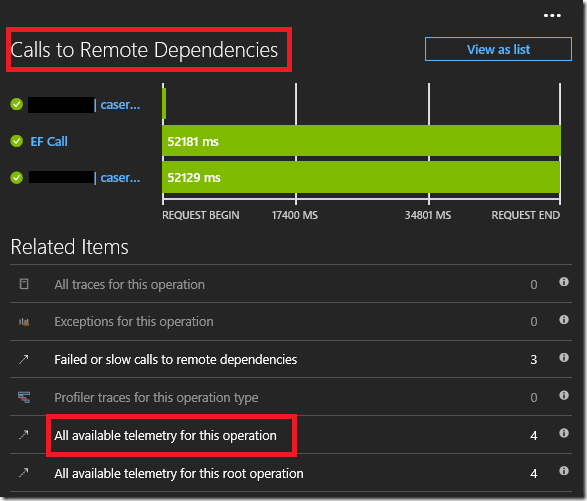
In this request blade you should see the dependency calls. This show
when the dependency call was invoked
and how long it took to execute
To get more details on this specific request, click on the
All available telemetry for this operation
and you should see trace statement, custom events, page view, dependency calls, exception if any for this Request as shown below