
This post has been republished via RSS; it originally appeared at: Ask the Directory Services Team articles.
First published on TechNet on Apr 05, 2017Hello AskDS readers and Identity aficionados. Long time no blog.
Ryan Ries here, and today I have a relatively "hardcore" blog post that will not be for the faint of heart. However, it's about an important topic.
The behavior surrounding security tokens and logon sessions has recently changed on all supported versions of Windows. IT professionals - developers and administrators alike - should understand what this new behavior is, how it can affect them, and how to troubleshoot it.
But first, a little background...
[caption id="attachment_16655" align="alignnone" width="394"]
 Figure 1 - Tokens[/caption]
Windows uses security tokens (or access tokens) extensively to control access to system resources. Every thread running on the system uses a security token, and may own several at a time. Threads inherit the security tokens of their parent processes by default, but they may also use special security tokens that represent other identities in an activity known as impersonation. Since security tokens are used to grant access to resources, they should be treated as highly sensitive, because if a malicious user can gain access to someone else's security token, they will be able to access resources that they would not normally be authorized to access.
Note: Here are some additional references you should read first if you want to know more about access tokens:
If you are an application developer, your application or service may want to create or duplicate tokens for the legitimate purpose of impersonating another user. A typical example would be a server application that wants to impersonate a client to verify that the client has permissions to access a file or database. The application or service must be diligent in how it handles these access tokens by releasing/destroying them as soon as they are no longer needed. If the code fails to call the CloseHandle function on a token handle, that token can then be "leaked" and remain in memory long after it is no longer needed.
And that brings us to Microsoft Security Bulletin MS16-111 .
Here is an excerpt from that Security Bulletin:
Multiple Windows session object elevation of privilege vulnerabilities exist in the way that Windows handles session objects.
A locally authenticated attacker who successfully exploited the vulnerabilities could hijack the session of another user.
To exploit the vulnerabilities, the attacker could run a specially crafted application.
The update corrects how Windows handles session objects to prevent user session hijacking.
Those vulnerabilities were fixed with that update, and I won't further expound on the "hacking/exploiting" aspect of this topic. We're here to explore this from a debugging perspective.
This update is significant because it changes how the relationship between tokens and logon sessions is treated across all supported versions of Windows going forward. Applications and services that erroneously leak tokens have always been with us, but the penalty paid for leaking tokens is now greater than before. After MS16-111, when security tokens are leaked, the logon sessions associated with those security tokens also remain on the system until all associated tokens are closed... even after the user has logged off the system. If the tokens associated with a given logon session are never released, then the system now also has a permanent logon session leak as well. If this leak happens often enough, such as on a busy Remote Desktop/Terminal Server where users are logging on and off frequently, it can lead to resource exhaustion on the server, performance issues and denial of service, ultimately causing the system to require a reboot to be returned to service.
Therefore, it's more important than ever to be able to identify the symptoms of token and session leaks, track down token leaks on your systems, and get your application vendors to fix them.
How Do I Know If My Server Has Leaks?
As mentioned earlier, this problem affects heavily-utilized Remote Desktop Session Host servers the most, because users are constantly logging on and logging off the server. The issue is not limited to Remote Desktop servers, but symptoms will be most obvious there.
Figuring out that you have logon session leaks is the easy part. Just run qwinsta at a command prompt:
[caption id="attachment_16665" align="alignnone" width="621"]
 Figure 2 - qwinsta[/caption]
Pay close attention to the session ID numbers, and notice the large gap between session 2 and session 152. This is the clue that the server has a logon session leak problem. The next user that logs on will get session 153, the next user will get session 154, the next user will get session 155, and so on. But the session IDs will never be reused. We have 150 "leaked" sessions in the screenshot above, where no one is logged on to those sessions, no one will ever be able to log on to those sessions ever again (until a reboot,) yet they remain on the system indefinitely. This means each user who logs onto the system is inadvertently leaving tokens lying around in memory, probably because some application or service on the system duplicated the user's token and didn't release it. These leaked sessions will forever be unusable and soak up system resources. And the problem will only get worse as users continue to log on to the system. In an optimal situation where there were no leaks, sessions 3-151 would have been destroyed after the users logged out and the resources consumed by those sessions would then be reusable by subsequent logons.
How Do I Find Out Who's Responsible?
Now that you know you have a problem, next you need to track down the application or service that is responsible for leaking access tokens. When an access token is created, the token is associated to the logon session of the user who is represented by the token, and an internal reference count is incremented. The reference count is decremented whenever the token is destroyed. If the reference count never reaches zero, then the logon session is never destroyed or reused. Therefore, to resolve the logon session leak problem, you must resolve the underlying token leak problem(s). It's an all-or-nothing deal. If you fix 10 token leaks in your code but miss 1, the logon session leak will still be present as if you had fixed none.
Before we proceed: I would recommend debugging this issue on a lab machine, rather than on a production machine. If you have a logon session leak problem on your production machine, but don't know where it's coming from, then install all the same software on a lab machine as you have on the production machine, and use that for your diagnostic efforts. You'll see in just a second why you probably don't want to do this in production.
The first step to tracking down the token leaks is to enable token leak tracking on the system.
Modify this registry setting:
HKLM\SYSTEM\CurrentControlSet\Control\Session Manager\Kernel
SeTokenLeakDiag = 1 (DWORD)
The registry setting won't exist by default unless you've done this before, so create it. It also did not exist prior to MS16-111, so don't expect it to do anything if the system does not have MS16-111 installed. This registry setting enables extra accounting on token issuance that you will be able to detect in a debugger, and there may be a noticeable performance impact on busy servers. Therefore, it is not recommended to leave this setting in place unless you are actively debugging a problem. (i.e. don't do it in production exhibit A.)
Prior to the existence of this registry setting, token leak tracing of this kind used to require using a checked build of Windows. And Microsoft seems to not be releasing a checked build of Server 2016, so... good timing.
Next, you need to configure the server to take a full or kernel memory dump when it crashes. (A live kernel debug may also be an option, but that is outside the scope of this article.) I recommend using DumpConfigurator to configure the computer for complete crash dumps. A kernel dump should be enough to see most of what we need, but get a Complete dump if you can.
[caption id="attachment_16675" align="alignnone" width="860"]
 Figure 3 - DumpConfigurator[/caption]
Then reboot the server for the settings to take effect.
Next, you need users to log on and off the server, so that the logon session IDs continue to climb. Since you're doing this in a lab environment, you might want to use a script to automatically logon and logoff a set of test users. (I provided a sample script for you here .) Make sure you've waited 10 minutes after the users have logged off to verify that their logon sessions are permanently leaked before proceeding.
Finally, crash the box. Yep, just crash it. (i.e. don't do it in production exhibit B.) On a physical machine, this can be done by hitting Right-Ctrl+Scroll+Scroll if you configured the appropriate setting with DumpConfigurator earlier. If this is a Hyper-V machine, you can use the following PowerShell cmdlet on the Hyper-V host:
Debug-VM -VM (Get-VM RDS1) -InjectNonMaskableInterrupt
You may have at your disposal other means of getting a non-maskable interrupt to the machine, such as an out-of-band management card (iLO/DRAC, etc.,) but the point is to deliver an NMI to the machine, and it will bugcheck and generate a memory dump.
Now transfer the memory dump file (C:\Windows\Memory.dmp usually) to whatever workstation you will use to perform your analysis.
Note: Memory dumps may contain sensitive information, such as passwords, so be mindful when sharing them with strangers.
Next, install the Windows Debugging Tools on your workstation if they're not already installed. I downloaded mine for this demo from the Windows Insider Preview SDK here . But they also come with the SDK, the WDK, WPT, Visual Studio, etc. The more recent the version, the better.
Next, download the MEX Debugging Extension for WinDbg . Engineers within Microsoft have been using the MEX debugger extension for years, but only recently has a public version of the extension been made available. The public version is stripped-down compared to the internal version, but it's still quite useful. Unpack the file and place mex.dll into your C:\Debuggers\winext directory, or wherever you installed WinDbg.
Now, ensure that your symbol path is configured correctly to use the Microsoft public symbol server within WinDbg:
[caption id="attachment_16685" align="alignnone" width="596"]
 Figure 4 - Example Symbol Path in WinDbg[/caption]
The example symbol path above tells WinDbg to download symbols from the specified URL, and store them in your local C:\Symbols directory.
Finally, you are ready to open your crash dump in WinDbg:
[caption id="attachment_16695" align="alignnone" width="415"]
 Figure 5 - Open Crash Dump from WinDbg[/caption]
After opening the crash dump, the first thing you'll want to do is load the MEX debugging extension that you downloaded earlier, by typing the command:
[caption id="attachment_16705" align="alignnone" width="269"]
 Figure 6 - .load mex[/caption]
The next thing you probably want to do is start a log file. It will record everything that goes on during this debugging session, so that you can refer to it later in case you forgot what you did or where you left off.
[caption id="attachment_16715" align="alignnone" width="652"]
 Figure 7 - !logopen[/caption]
Another useful command that is among the first things I always run is !DumpInfo, abbreviated !di, which simply gives some useful basic information about the memory dump itself, so that you can verify at a glance that you've got the correct dump file, which machine it came from and what type of memory dump it is.
[caption id="attachment_16725" align="alignnone" width="620"]
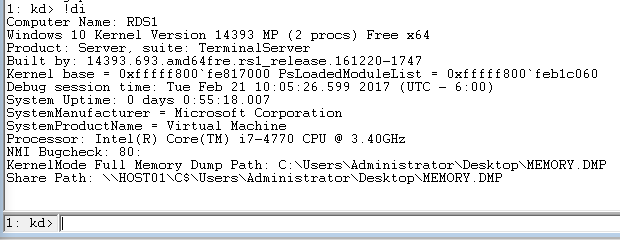 Figure 8 - !DumpInfo[/caption]
You're ready to start debugging.
At this point, I have good news and I have bad news.
The good news is that there already exists a super-handy debugger extension that lists all the logon session kernel objects, their associated token reference counts, what process was responsible for creating the token, and even the token creation stack, all with a single command! It's
!kdexts.logonsession , and it is awesome .
The bad news is that it doesn't work... not with public symbols. It only works with private symbols. Here is what it looks like with public symbols:
[caption id="attachment_16735" align="alignnone" width="1163"]
 Figure 9 - !kdexts.logonsession - public symbols lead to lackluster output[/caption]
As you can see, most of the useful stuff is zeroed out.
Since public symbols are all you have unless you work at Microsoft, ( and we wish you did ,) I'm going to teach you how to do what
!kdexts.logonsession does, manually. The hard way. Plus some extra stuff. Buckle up.
First, you should verify whether token leak tracking was turned on when this dump was taken. (That was the registry setting mentioned earlier.)
[caption id="attachment_16745" align="alignnone" width="530"]
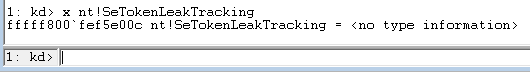 Figure 10 - x nt!SeTokenLeakTracking = <no type information>[/caption]
OK... That was not very useful. We're getting <no type information> because we're using public symbols. But this symbol corresponds to the SeTokenLeakDiag registry setting that we configured earlier, and we know that's just 0 or 1, so we can just guess what type it is:
[caption id="attachment_16755" align="alignnone" width="307"]
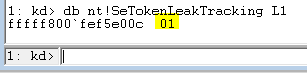 Figure 11 - db nt!SeTokenLeakTracking L1[/caption]
The db command means "dump bytes." (dd, or "dump DWORDs," would have worked just as well.) You should have a symbol for
nt!SeTokenLeakTracking if you configured your symbol path properly, and the L1 tells the debugger to just dump the first byte it finds. It should be either 0 or 1. If it's 0, then the registry setting that we talked about earlier was not set properly, and you can basically just discard this dump file and get a new one. If it's 1, you're in business and may proceed.
Next, you need to locate the logon session lists.
[caption id="attachment_16765" align="alignnone" width="305"]
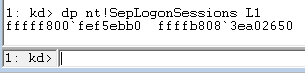 Figure 12 - dp nt!SepLogonSessions L1[/caption]
Like the previous step, dp means "display pointer," then the name of the symbol, and L1 to just display a single pointer. The 64-bit value on the right is the pointer, and the 64-bit value on the left is the memory address of that pointer.
Now we know where our lists of logon sessions begin. (Lists, plural.)
The SepLogonSessions pointer points to not just a list, but an array of lists. These lists are made up of _SEP_LOGON_SESSION_REFERENCES structures.
Using the dps command (display contiguous pointers) and specifying the beginning of the array that we got from the last step, we can now see where each of the lists in the array begins:
[caption id="attachment_16775" align="alignnone" width="345"]
 Figure 13 - dps 0xffffb808`3ea02650 – displaying pointers that point to the beginning of each list in the array[/caption]
If there were not very many logon sessions on the system when the memory dump was taken, you might notice that not all the lists are populated:
[caption id="attachment_16785" align="alignnone" width="337"]
 Figure 14 - Some of the logon session lists are empty because not very many users had logged on in this example[/caption]
The array doesn't fill up contiguously, which is a bummer. You'll have to skip over the empty lists.
If we wanted to walk just the first list in the array (we'll talk more about dt and linked lists in just a minute,) it would look something like this:
[caption id="attachment_16795" align="alignnone" width="721"]
 Figure 15 - Walking the first list in the array and using !grep to filter the output[/caption]
Notice that I used the !grep command to filter the output for the sake of brevity and readability. It's part of the Mex debugger extension. I told you it was handy. If you omit the !grep AccountName part, you would get the full, unfiltered output. I chose "AccountName" arbitrarily as a keyword because I knew that was a word that was unique to each element in the list. !grep will only display lines that contain the keyword(s) that you specify.
Next, if we wanted to walk through the entire array of lists all at once, it might look something like this:
[caption id="attachment_16797" align="alignnone" width="1031"]
 Figure 16 - Walking through the entire array of lists![/caption]
OK, I realize that I just went bananas there, but I'll explain what just happened step-by-step.
When you are using the Mex debugger extension, you have access to many new text parsing and filtering commands that can truly enhance your debugging experience. When you look at a long command like the one I just showed, read it from right to left. The commands on the right are fed into the command to their left.
So from right to left, let's start with !cut -f 2 dps ffffb808`3ea02650
We already showed what the dps <address> command did earlier. The !cut -f 2 command filters that command's output so that it only displays the second part of each line separated by whitespace. So essentially, it will display only the pointers themselves, and not their memory addresses.
Like this:
[caption id="attachment_16805" align="alignnone" width="324"]
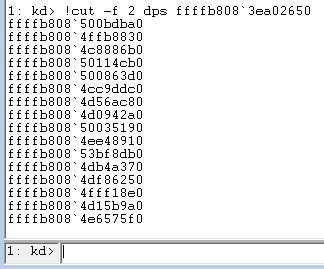 Figure 17 - Using !cut to select just the second token in each line of output[/caption]
Then that is "piped" line-by-line into the next command to the left, which was:
!fel -x "dt nt!_SEP_LOGON_SESSION_REFERENCES @#Line -l Next"
!fel is an abbreviation for !foreachline.
This command instructs the debugger to execute the given command for each line of output supplied by the previous command, where the @#Line pseudo-variable represents the individual line of output. For each line of output that came from the dps command, we are going to use the dt command with the -l parameter to walk that list. (More on walking lists in just a second.)
Next, we use the !grep command to filter all of that output so that only a single unique line is shown from each list element, as I showed earlier.
Finally, we use the !count -q command to suppress all of the output generated up to that point, and instead only tell us how many lines of output it would have generated. This should be the total number of logon sessions on the system.
And 380 was in fact the exact number of logon sessions on the computer when I collected this memory dump. (Refer to Figure 16.)
Alright... now let's take a deep breath and a step back. We just walked an entire array of lists of structures with a single line of commands. But now we need to zoom in and take a closer look at the data structures contained within those lists.
Remember, ffffb808`3ea02650 was the very beginning of the entire array.
Let's examine just the very first _SEP_LOGON_SESSION_REFERENCES entry of the first list, to see what such a structure looks like:
[caption id="attachment_16806" align="alignnone" width="705"]
 Figure 18 - dt _SEP_LOGON_SESSION_REFERENCES* ffffb808`3ea02650[/caption]
That's a logon session!
Let's go over a few of the basic fields in this structure. (Skipping some of the more advanced ones.)
- Next : This is a pointer to the next element in the list. You might notice that there's a "Next," but there's no "Previous." So, you can only walk the list in one direction. This is a singly-linked list.
- LogonId : Every logon gets a unique one. For example, "0x3e7" is always the "System" logon.
- ReferenceCount : This is how many outstanding token references this logon session has. This is the number that must reach zero before the logon session can be destroyed. In our example, it's 4.
- AccountName : The user who does or used to occupy this session.
- AuthorityName : Will be the user's Active Directory domain, typically. Or the computer name if it's a local account.
- TokenList : This is a doubly or circularly-linked list of the tokens that are associated with this logon session. The number of tokens in this list should match the ReferenceCount.
The following is an illustration of a doubly-linked list:
[caption id="attachment_16815" align="alignnone" width="567"]
 Figure 19 - Doubly or circularly-linked list[/caption]
"Flink" stands for Forward Link, and "Blink" stands for Back Link.
So now that we understand that the TokenList member of the _SEP_LOGON_SESSION_REFERENCES structure is a linked list, here is how you walk that list:
[caption id="attachment_16825" align="alignnone" width="862"]
 Figure 20 - dt nt!_LIST_ENTRY* 0xffffb808`500bdba0+0x0b0 -l Flink[/caption]
The dt command stands for "display type," followed by the symbol name of the type that you want to cast the following address to. The reason why we specified the address 0xffffb808`500bdba0 is because that is the address of the _SEP_LOGON_SESSION_REFERENCES object that we found earlier. The reason why we added +0x0b0 after the memory address is because that is the offset from the beginning of the structure at which the TokenList field begins. The -l parameter specifies that we're trying to walk a list, and finally you must specify a field name (Flink in this case) that tells the debugger which field to use to navigate to the next node in the list.
We walked a list of tokens and what did we get? A list head and 4 data nodes, 5 entries total, which lines up with the ReferenceCount of 4 tokens that we saw earlier. One of the nodes won't have any data – that's the list head.
Now, for each entry in the linked list, we can examine its data. We know the payloads that these list nodes carry are tokens, so we can use dt to cast them as such:
[caption id="attachment_16835" align="alignnone" width="773"]
 Figure 21 - dt _TOKEN*0xffffb808`4f565f40+8+8 - Examining the first token in the list[/caption]
The reason for the +8+8 on the end is because that's the offset of the payload. It's just after the Flink and Blink as shown in Figure 19. You want to skip over them.
We can see that this token is associated to SessionId 0x136/0n310. (Remember I had 380 leaked sessions in this dump.) If you examine the UserAndGroups member by clicking on its DML (click the link,) you can then use !sid to see the SID of the user this token represents:
[caption id="attachment_16845" align="alignnone" width="962"]
 Figure 22 - Using !sid to see the security identifier in the token[/caption]
The token also has a DiagnosticInfo structure, which is super-interesting, and is the coolest thing that we unlocked when we set the SeTokenLeakDiag registry setting on the machine earlier. Let's look at it:
[caption id="attachment_16846" align="alignnone" width="1096"]
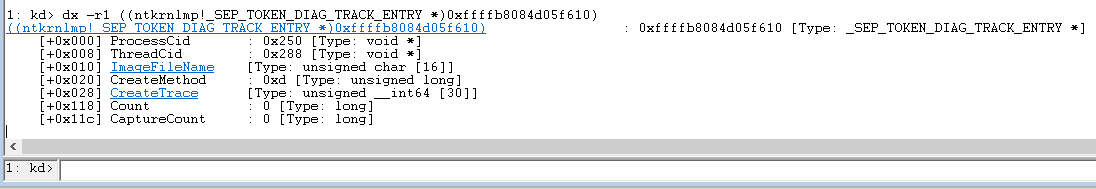 Figure 23 - Examining the DiagnosticInfo structure of the first token[/caption]
We now have the process ID and the thread ID that was responsible for creating this token! We could examine the ImageFileName, or we could use the ProcessCid to see who it is:
[caption id="attachment_16855" align="alignnone" width="635"]
 Figure 24 - Using !mex.tasklist to find a process by its PID[/caption]
Oh... Whoops . Looks like this particular token leak is lsass's fault. You're just going to have to let the *ahem* application vendor take care of that one.
Let's move on to a different token leak. We're moving on to a different memory dump file as well, so the memory addresses are going to be different from here on out.
I created a special token-leaking application specifically for this article. It looks like this:
[caption id="attachment_16856" align="alignnone" width="618"]
 Figure 25 - RyansTokenGrabber.exe[/caption]
It monitors the system for users logging on, and as soon as they do, it duplicates their token via the DuplicateToken API call. I purposely never release those tokens, so if I collect a memory dump of the machine while this is running, then evidence of the leak should be visible in the dump, using the same steps as before.
Using the same debugging techniques I just demonstrated, I verified that I have leaked logon sessions in this memory dump as well, and each leaked session has an access token reference that looks like this:
[caption id="attachment_16865" align="alignnone" width="628"]
 Figure 26 - A _TOKEN structure shown with its attached DiagnosticInfo[/caption]
And then by looking at the token's DiagnosticInfo, we find that the guilty party responsible for leaking this token is indeed RyansTokenGrabber.exe:
[caption id="attachment_16875" align="alignnone" width="745"]
 Figure 27 - The process responsible for leaking this token[/caption]
By this point you know who to blame, and now you can go find the author of RyansTokenGrabber.exe, and show them the stone-cold evidence that you've collected about how their application is leaking access tokens, leading to logon session leaks, causing you to have to reboot your server every few days, which is a ridiculous and inconvenient thing to have to do, and you shouldn't stand for it!
We're almost done. but I have one last trick to show you.
If you examine the StackTrace member of the token's DiagnosticInfo, you'll see something like this:
[caption id="attachment_16885" align="alignnone" width="1009"]
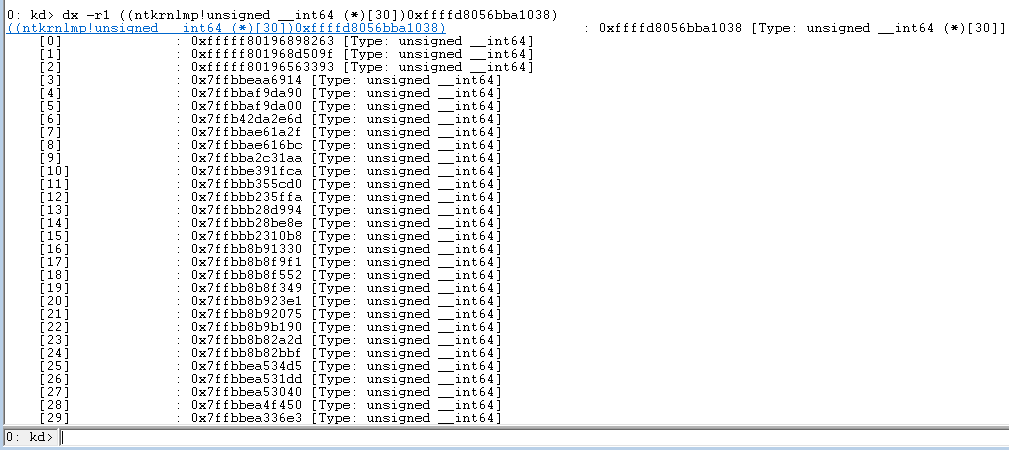 Figure 28 - DiagnosticInfo.CreateTrace[/caption]
This is a stack trace. It's a snapshot of all the function calls that led up to this token's creation. These stack traces grew upwards, so the function at the top of the stack was called last. But the function addresses are not resolving. We must do a little more work to figure out the names of the functions.
First, clean up the output of the stack trace:
[caption id="attachment_16895" align="alignnone" width="738"]
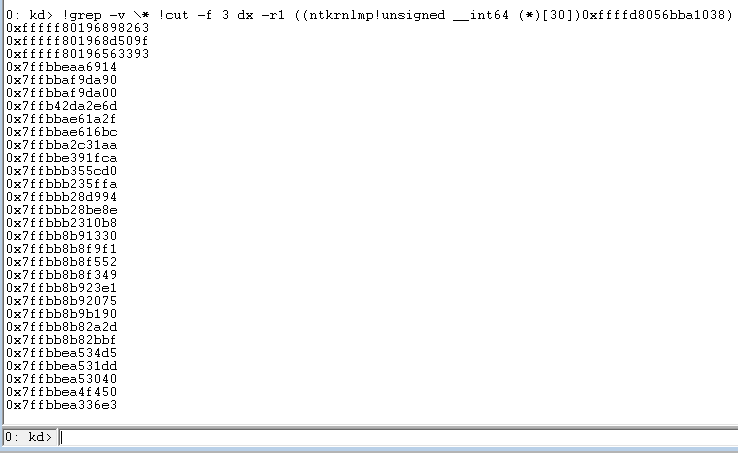 Figure 29 - Using !grep and !cut to clean up the output[/caption]
Now, using all the snazzy new Mex magic you've learned, see if you can unassemble (that's the u command) each address to see if resolves to a function name:
[caption id="attachment_16896" align="alignnone" width="917"]
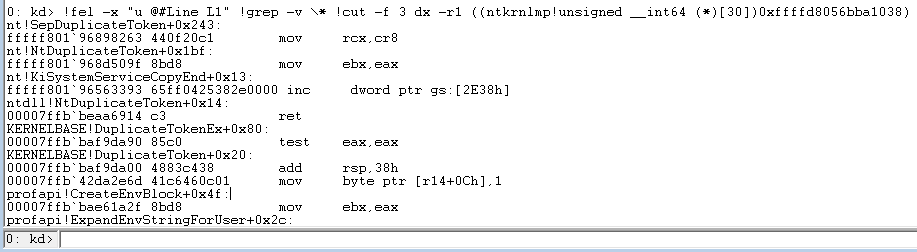 Figure 30 - Unassemble instructions at each address in the stack trace[/caption]
The output continues beyond what I've shown above, but you get the idea.
The function on top of the trace will almost always be SepDuplicateToken, but could also be SepCreateToken or SepFilterToken, and whether one creation method was used versus another could be a big hint as to where in the program's code to start searching for the token leak. You will find that the usefulness of these stacks will vary wildly from one scenario to the next, as things like inlined functions, lack of symbols, unloaded modules, and managed code all influence the integrity of the stack. However, you (or the developer of the application you're using) can use this information to figure out where the token is being created in this program, and fix the leak.
Alright, that's it. If you're still reading this, then... thank you for hanging in there. I know this wasn't exactly a light read.
And lastly, allow me to reiterate that this is not just a contrived, unrealistic scenario; There's a lot of software out there on the market that does this kind of thing. And if you happen to write such software, then I really hope you read this blog post. It may help you improve the quality of your software in the future. Windows needs application developers to be "good citizens" and avoid writing software with the ability to destabilize the operating system. Hopefully this blog post helps someone out there do just that.
Until next time,
Ryan "Too Many Tokens" Ries
Hi,Does this aplies to lsass using much memory until 100% maybe because lsass leak?