This post has been republished via RSS; it originally appeared at: New blog articles in Microsoft Tech Community.
IIS default configuration is optimized for speed. However, you may notice slowness loading your websites reasons such as the inefficient application code.
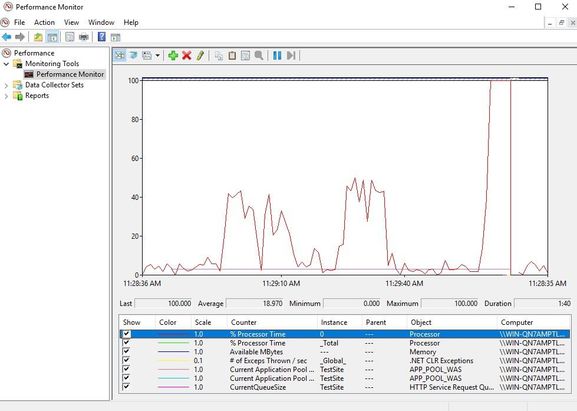
I would recommend checking the performance counters below if you want to monitor the resource usage in IIS server:
- Processor (All instances – % Processor Time): CPU consumption by processes
- Memory (Available Mbytes): Available memory in Windows Server
- HTTP Service Request Queues (CurrentQueueSize): The request count in the IIS queue
- .NET CLR Exceptions (# of Exceptions Thrown/sec): Amount of System.NullReferenceException thrown
- APP_POOL_WAS (For all listed Application Pools):
- Current Application Pool State: The state of application pools
- Current Application Pool Uptime: The web application uptime period since the last restart
In order to monitor performance counters:
- Go to Start
- Search for “Performance Monitor“
- Click on the green plus sign (+) at the top of the window
- Choose a category (Processor, Memory etc.)
- Choose a sub-category (% Processor Time, Available Mbytes etc.)
- Choose an object (_Total, <All instances> etc.)
- Click “Add“
- Click “OK“
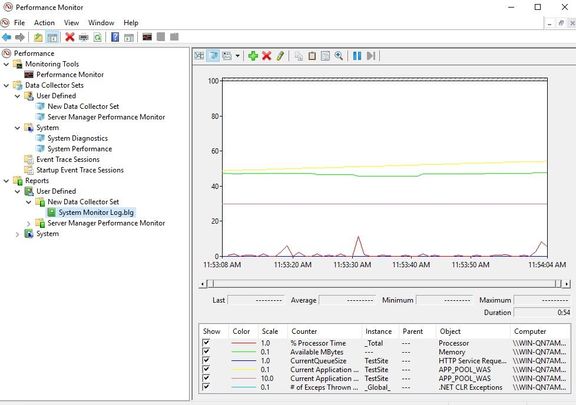
With the instructions above, you can monitor the real-time statistics of your server. If you want to save results:
- Right click on “Performance Monitor” under “Monitoring Tools”
- Choose “New > Data Collector Set”
- Enter a name and click “Next“
- Select a folder to save the data. Click “Next“
- Check “Start this data collector set now” and click “Finish“
- There will be an arrow icon on the collector set. It means it’s recording the logs. Once you want to stop recording, right click on the collector set and select “Stop“
- Go to the path you specified in Step 4 OR click “Latest report” button (Green notebook icon) to see the report


