This post has been republished via RSS; it originally appeared at: Microsoft Research.
The rise of deep learning is accompanied by ever-increasing model complexity, larger datasets, and longer training times for models. When working on novel concepts, researchers often need to understand why training metrics are trending the way they are. So far, the available tools for machine learning training have focused on a “what you see is what you log” approach. As logging is relatively expensive, researchers and engineers tend to avoid it and rely on a few signals to guesstimate the cause of the patterns they see. At Microsoft Research, we’ve been asking important questions surrounding this very challenge: What if we could dramatically reduce the cost of getting more information about the state of the system? What if we had advanced tooling that could help researchers make more informed decisions effectively?
Introducing TensorWatch
We’re happy to introduce TensorWatch, an open-source system that implements several of these ideas and concepts. We like to think of TensorWatch as the Swiss Army knife of debugging tools with many advanced capabilities researchers and engineers will find helpful in their work. We presented TensorWatch at the 2019 ACM SIGCHI Symposium on Engineering Interactive Computing Systems.
Custom UIs and visualizations
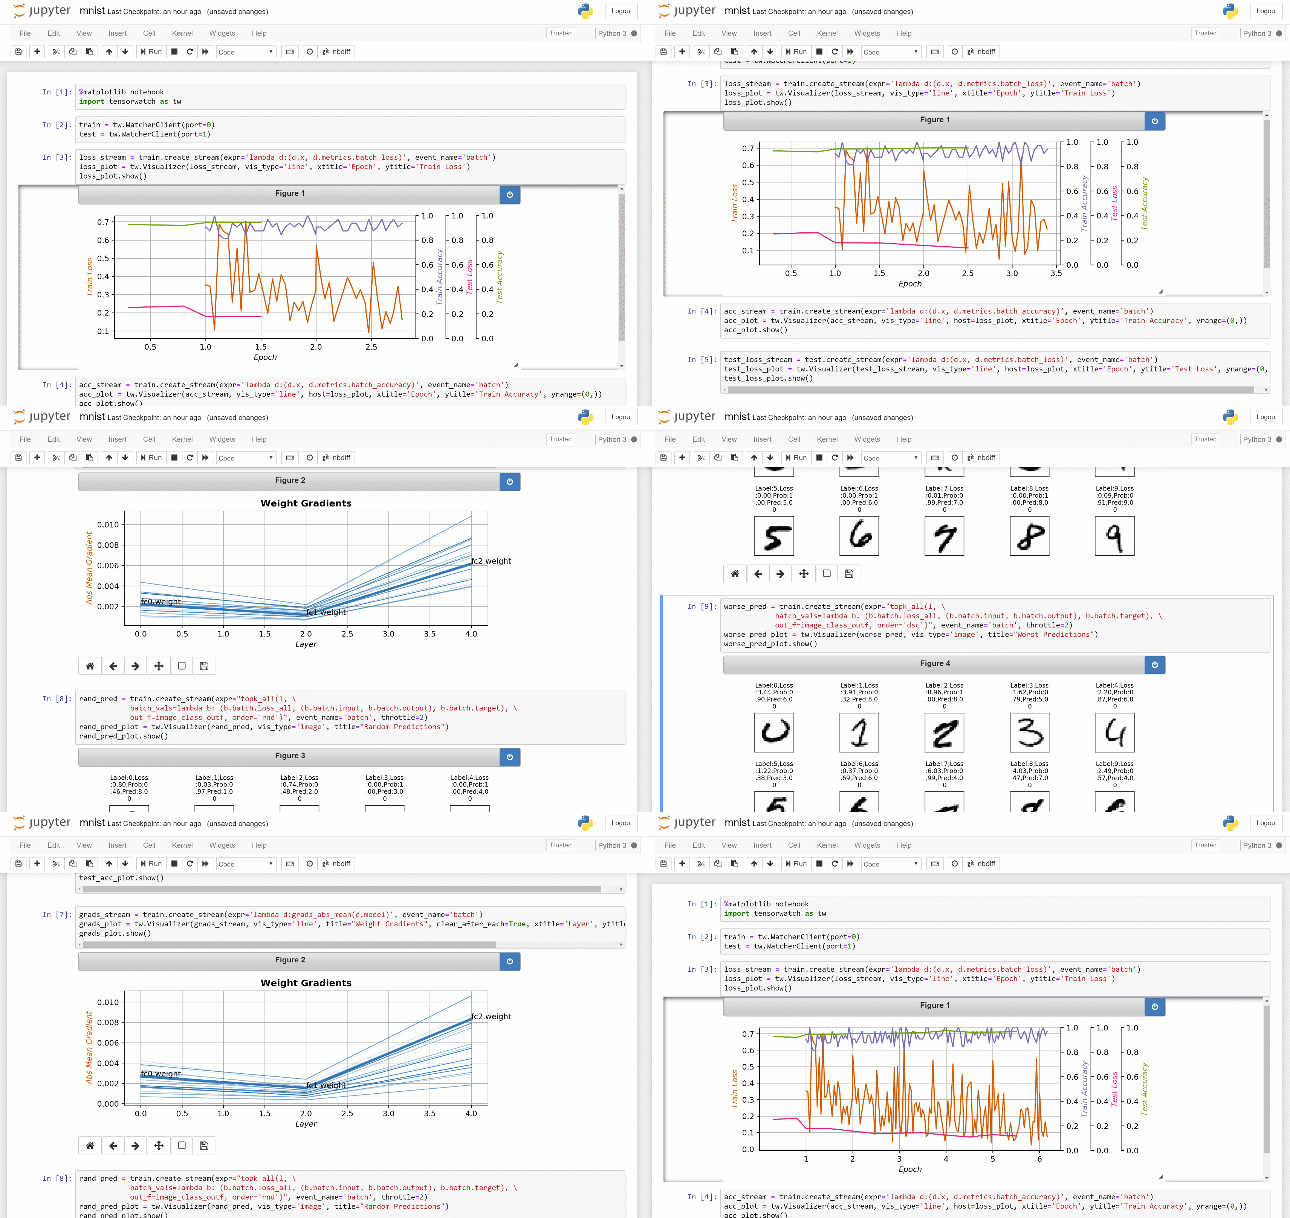
The first thing you might notice when using TensorWatch is it extensively leverages Jupyter Notebook instead of prepackaged user interfaces, which are often difficult to customize. TensorWatch provides the interactive debugging of real-time training processes using either the composable UI in Jupyter Notebooks or the live shareable dashboards in Jupyter Lab. In addition, since TensorWatch is a Python library, you can also build your own custom UIs or use TensorWatch in the vast Python data science ecosystem. TensorWatch also supports several standard visualization types, including bar charts, histograms, and pie charts, as well as 3D variations.

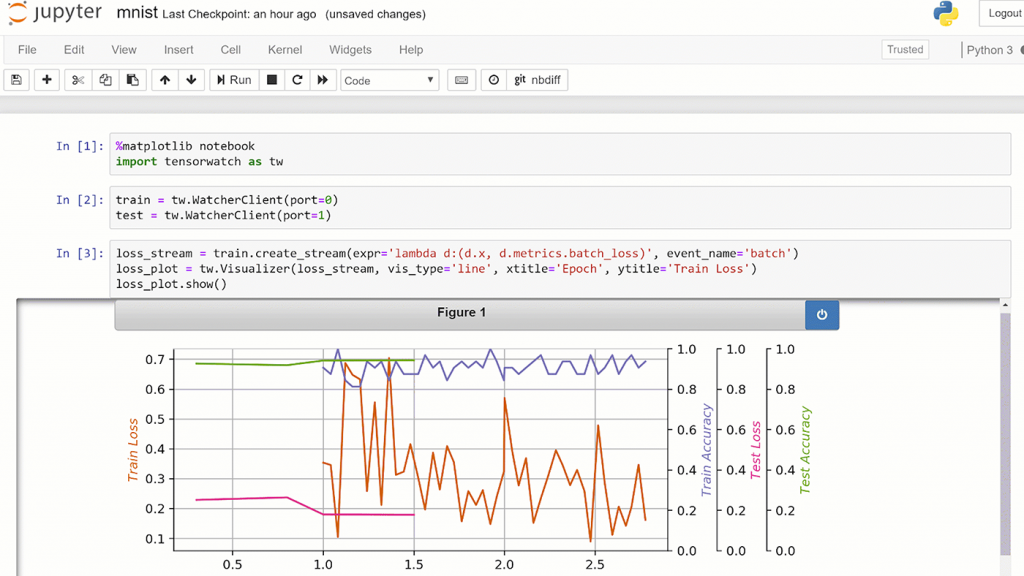
With TensorWatch—a debugging and visualization tool for machine learning—researchers and engineers can customize the user interface to accommodate a variety of scenarios. Above is an example of TensorWatch running in Jupyter Notebook, rendering a live chart from multiple streams produced by an ML training application.
Streams, streams everywhere
One of the central premises of the TensorWatch architecture is we uniformly treat data and other objects as streams. This includes files, console, sockets, cloud storage, and even visualizations themselves. With a common interface, TensorWatch streams can listen to other streams, which enables the creation of custom data flow graphs. Using these concepts, TensorWatch trivially allows you to implement a variety of advanced scenarios. For example, you can render many streams into the same visualization, or one stream can be rendered in many visualizations simultaneously, or a stream can be persisted in many files, or not persisted at all. The possibilities are endless!

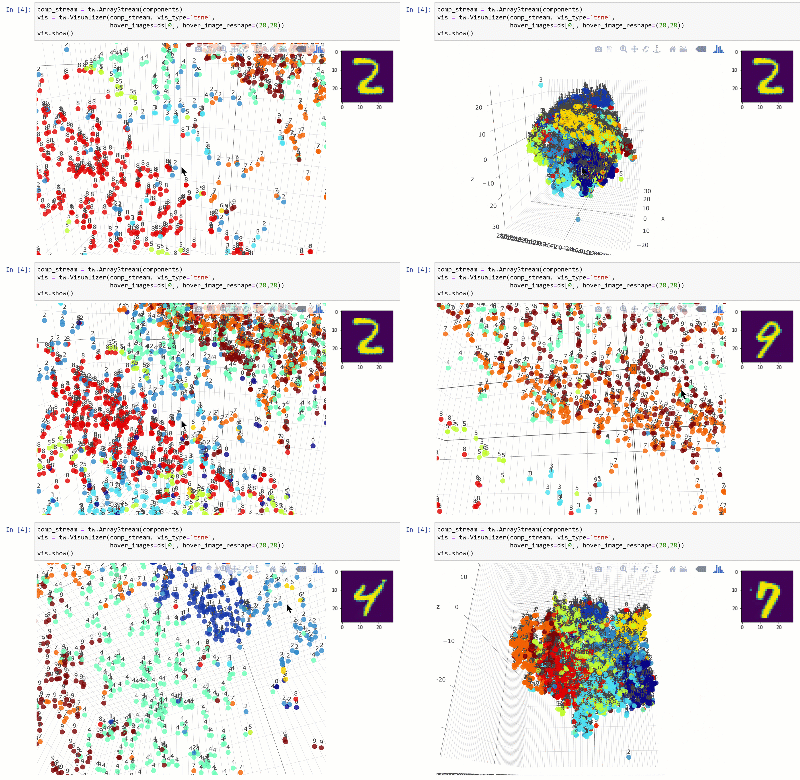
TensorWatch supports a variety of visualization types. Above is an example of a TensorWatch t-SNE visualization of the MNIST dataset.
Lazy logging mode
With TensorWatch, we also introduce lazy logging mode. This mode doesn’t require explicit logging of all the information beforehand. Instead, you can have TensorWatch observe the variables. Since observing is basically free, you can track as many variables as you like, including large models or entire batches during the training. TensorWatch then allows you to perform interactive queries that run in the context of these variables and returns the streams as a result. These streams can then be visualized, saved, or processed as needed. For example, you can write a lambda expression that computes mean weight gradients in each layer in the model at the completion of each batch and send the result as a stream of tensors that can be plotted as a bar chart.
Phases of model development
At Microsoft Research, we care deeply about improving debugging capabilities in all phases of model development—pre-training, in-training, and post-training. Consequently, TensorWatch provides many features useful for pre- and post-training phases as well. We lean on several excellent open-source libraries to enable many of these features, which include model graph visualization, data exploration through dimensionality reduction, model statistics, and several prediction explainers for convolution networks.
Open source on GitHub
We hope TensorWatch helps spark further advances and ideas for efficiently debugging and visualizing machine learning and invite the ML community to participate in this journey via GitHub.
The post Microsoft makes AI debugging and visualization tool TensorWatch open source appeared first on Microsoft Research.

