Introduction
Network beaconing is generally described as network traffic originating from victim`s network towards adversary controlled infrastructure that occurs at regular intervals which could be an indication of malware infection or compromised host doing data exfiltration. This article will discuss the use case of detecting network beaconing via intra-request time delta patterns using KQL (Kusto query language) in Azure Sentinel. The logic or technique of the use-case was originally discussed at threat hunting project here and also blogged with the open source network analytics tool (flare) implementation by huntoperator here. Implementing this technique natively using KQL allows defenders to quickly apply it over multiple network data sources and easily set up alerts within Azure Sentinel.
Use case workflow:
The diagram below outlines the various stages in compiling this detection and associated KQL operators underneath each stage.
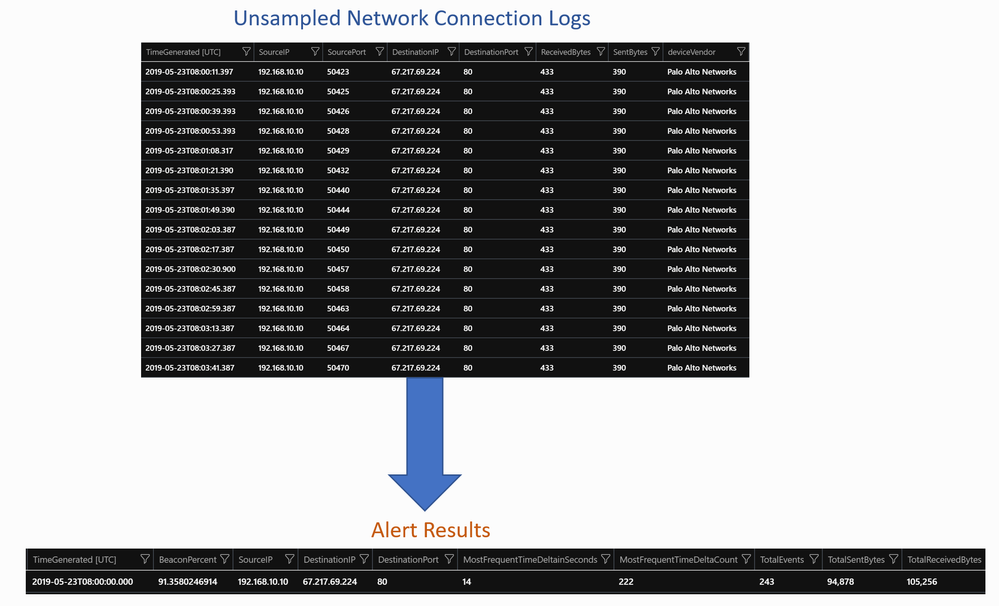
Below is sample screenshot of data transformation from Original Unsampled or non-aggregated network connection logs to Alert Results post executing the detection query
Query:
Github Link: PaloAlto Network Beaconing
let endtime = 1d;
let TimeDeltaThreshold = 10;
let TotalEventsThreshold = 15;
let PercentBeaconThreshold = 80;
let PrivateIPregex = @”^127\.|^10\.|^172\.1[6-9]\.|^172\.2[0-9]\.|^172\.3[0-1]\.|^192\.168\.”;
CommonSecurityLog
| where DeviceVendor ==”Palo Alto Networks” and Activity == “TRAFFIC”;
| where TimeGenerated between (ago(starttime)..ago(endtime))
| extend DestinationIPType = iff(DestinationIP matches regex PrivateIPregex,”private” ,”public” )
| where DestinationIPType ==”public”;
| project TimeGenerated , SourceIP , SourcePort , DestinationIP, DestinationPort, ReceivedBytes, SentBytes
| sort by SourceIP asc,TimeGenerated asc, DestinationIP asc, DestinationPort asc
| serialize
| extend nextTimeGenerated = next(TimeGenerated, 1), nextSourceIP = next(SourceIP, 1)
| extend TimeDeltainSeconds = datetime_diff(“second”,nextTimeGenerated,TimeGenerated)
| where SourceIP == nextSourceIP
//Whitelisting criteria/ threshold criteria
| where TimeDeltainSeconds > TimeDeltaThreshold
| project TimeGenerated, TimeDeltainSeconds, SourceIP, SourcePort,DestinationIP,DestinationPort, ReceivedBytes, SentBytes
| summarize count(), sum(ReceivedBytes), sum(SentBytes), make_list(TimeDeltainSeconds) by TimeDeltainSeconds, bin(TimeGenerated, 1h), SourceIP, DestinationIP, DestinationPort
| summarize (MostFrequentTimeDeltaCount, MostFrequentTimeDeltainSeconds)=arg_max(count_, TimeDeltainSeconds), TotalEvents=sum(count_), TotalSentBytes=sum(sum_SentBytes),TotalReceivedBytes=sum(sum_ReceivedBytes) by bin(TimeGenerated, 1h), SourceIP, DestinationIP, DestinationPort
| where TotalEvents >TotalEventsThreshold
| extend BeaconPercent = MostFrequentTimeDeltaCount/toreal(TotalEvents) * 100
| where BeaconPercent > PercentBeaconThreshold
Step 1: Load Raw logs- unsampled network connections
In this stage, we will select the data source which will have unsampled or non-aggregated raw logs. The data source can be network firewall, proxy logs etc. Below section of the query refers to selecting the data source (in this example- Palo Alto Firewall) and loading the relevant data.
| where DeviceVendor ==”Palo Alto Networks” and Activity == “TRAFFIC”
| where TimeGenerated between (ago(starttime)..ago(endtime))
Step 2: Filter – Internal to External Traffic
This step involves filtering the raw logs loaded in the first stage to only focus on traffic directing from internal networks to external Public networks. This is achieved by populating IP Type as Private and Public based on PrivateIP regex. You can use any other data sources such as joining against internal asset inventory data source with matches as Internal and rest as external.
| where DestinationIPType ==”public”
| project TimeGenerated , SourceIP , SourcePort , DestinationIP, DestinationPort, ReceivedBytes, SentBytes
Step 3: Data Serialization – sort, reorder
This step is used to reorder the logs using serialize operator. It is required to reorder the data in correct order as we will calculate time delta from sequential events for the same source addresses.
| serialize
Step 4: Time Delta Calculation
This step is used to calculate time delta using prev() and next() functions. In order to use these functions, the data should be in correct order achieved from Step-3. The timestamp of the next event is accessed using next function and later datetime_diff() is used to calculate time difference between two timestamps. It is made sure that source IP address of the next event is same. The unit used is in seconds. Final output is projected with selected columns along with data transfer in bytes.
| extend TimeDeltainSeconds = datetime_diff(‘second’,nextTimeGenerated,TimeGenerated)
| where SourceIP == nextSourceIP
Step 5: Data Reshaping- aggregation using window functions
In this step, data resulted from step 4 is further aggregated to downsample the data per hour time window without losing the context. First, In addition to using sum() and count() functions to aggregate, make_list() is used to make array of Time Delta values which are grouped by sourceip, destinationip and destinationports. Later, This array of values is transformed into count of each values to find most frequent or repetitive timedelta value using arg_max() function. At the end, BeaconPercent is calculated using simple formula : count of most frequent time delta divided by total events.
| summarize count(), sum(ReceivedBytes), sum(SentBytes), make_list(TimeDeltainSeconds) by TimeDeltainSeconds, bin(TimeGenerated, 1h), SourceIP, DestinationIP, DestinationPort
| summarize (MostFrequentTimeDeltaCount, MostFrequentTimeDeltainSeconds)=arg_max(count_, TimeDeltainSeconds), TotalEvents=sum(count_), TotalSentBytes=sum(sum_SentBytes),TotalReceivedBytes=sum(sum_ReceivedBytes) by bin(TimeGenerated, 1h), SourceIP, DestinationIP, DestinationPort
Step 6: Filter – Global Threshold Parameters
At various stages of the query, filtering is used to reduce the input data set in scope. At the top of the query, we have several global arguments declared which can be tweaked for alerting.
- TimeDeltathreshold: The value refers to the timedelta in seconds between 2 connections. With this parameters , noisy events with very low threshold value (such as 1 seconds to 10 seconds) will be filtered and not considered for alerting.
- TotalEventsThreshold: The value refers to the total count of events seen between the same source and destination aggregated per destination port
- PercentBeaconThreshold: The value refers to the percentage of beacon values based on the formula of mostfrequenttimedelta/totalevents
Interpreting Results:
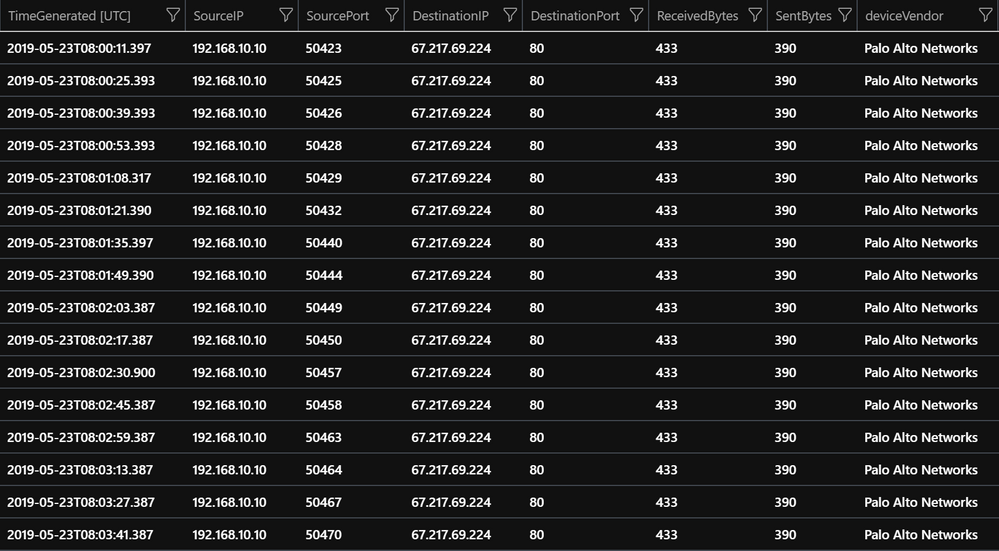
In this case, we will start hunting with unsampled or non-aggregated network connection logs from any network sensor logs. The logs should include at least sourceport and destinationPort along with source and destination address fields.
Below is an example output of Palo Alto traffic logs from Azure Sentinel.
After executing the query and based on the globally configured threshold, alerts will be triggered. Example alert results will look like below.
Apart from the known fields from the original logs such as TimeGenerated, SourceIP, DestinationIP, DestinationPort, TotalEvents,TotalSentBytes,TotalReceivedBytes, below additional enriched fields are populated by query.
- MostFrequentTimeDeltainSenconds : Repetitive Time interval between successive network connection in seconds.
- MostFrequentTimeDeltaCount: Count of the MostFrequentTimeDeltaInSeconds occurred within the timestamp.
- BeaconPercent: Percentage of beaconing calculated based on formula of MostFrequentTimeDeltaCount/TotalEvents* 100 .
The alert indicates
- 91% beaconing traffic seen from the source address 192.168.10.10 towards destination address- 67.217.69.224.
- Total 243 events observed in the hour 2019-05-25 08:00 to 09:00.
- Out of those, 222 events seen with 14 seconds time intervals.
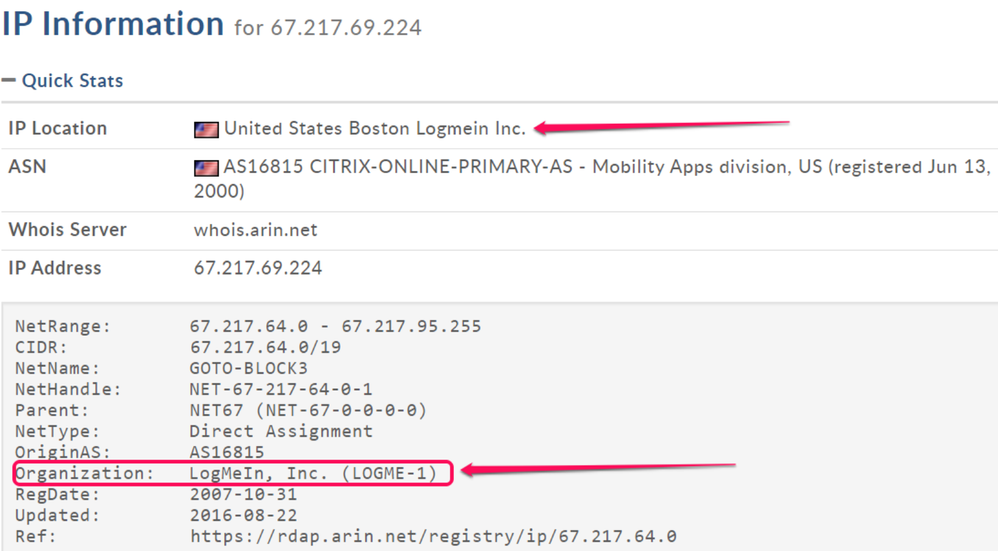
Whois query for the IP reveals, it is registered with LogmeIn. This could be benign behavior if you are using the application in your environments, else this could be indication of unauthorized installation on compromised host. Similar ways, you could detect other legitimate or unauthorized applications usage exhibiting beaconing behaviors.
Things to remember before onboarding this detection:
The way this detection is designed, there are some limitations or things to be considered before on-boarding this detection in your environment.
- Since detection requires unsampled network connection logs, you should not on-board detection for environments which has multiple hosts behind a proxy and firewall/network sensor logs shows only proxy IP address as source or if you are doing aggregation at any stage of your data ingestion.
- The detection is not filtered for any specific ports but consider approaches to reduce the input data scope by filtering traffic either to known destination addresses or destination ports if those. Time delta calculation is an expensive operation and reducing the input data set to correct scope will make it more efficient.
- You will also see legitimate beaconing traffic to known device vendors such as traffic towards Microsoft related to windows update, traffic to device manufacture vendors or any other legitimate application or agent configured to initiate network connection at scheduled intervals. Based on historical analysis you can understand baseline, and use it to filter such IP ranges to reduce false positives.
- Lastly, the detection is alerted based on the most repetitive time delta values but adversary can also add jitter or randomness so time intervals values between individual network connection will look different and will not match to PercentBeacon threshold values. You could still use your baseline analysis and other parameters of the dataset and derive additional hunting queries.
Conclusion:
In this article, we looked into previously discussed technique of detecting beaconing using intra-time delta patterns and how it can be implemented using native KQL within Azure Sentinel. The logic of the detection involves various stages starting from loading raw logs to doing various data transformation and finally alerting the results based on globally configured threshold values.
Unsampled/ non-aggregated network connection logs are very voluminous in nature and finding actionable events are always challenging. Even if you follow traditional approaches such as matching with IOCs, application or service profiling, various type of visualizations , due to the sheer scale of the data ,results from such techniques are not often directly actionable for analysts and need further ways to hunt for malicious traffic. With this unique analysis technique, we can find beacon like traffic patterns from your internal networks towards untrusted public destinations and directly investigate the results. The output alert results also provide useful context on the type of network traffic seen with basic packet statistics and why it has categorized as beaconing with additional attributes such as amount of data transferred to assist analysts to do alert triage.
From the example covered in the article, we were able to detect logmein traffic which was exhibiting beaconing behavior based on the repetitive time delta patterns in the given hour. We also talked about the scenarios where detection should not be onboarded depending on how environment is setup or data ingestion is set up.
Special thanks to Microsoft Kusto Discussions community who assisted with Data Reshaping stage of the query. You can also ask questions related to KQL at stackoverflow here.
Happy hunting.
References:
- ThreatHunting Project- Github
- Detect Beaconing with Flare, Elastic Stack, and Intrusion Detection Systems
- Command and Control : MITRE Technique TA0011
https://attack.mitre.org/tactics/TA0011/
- KQL operators syntax and example usage documentation:
- Serialize: https://docs.microsoft.com/en-us/azure/kusto/query/serializeoperator
- prev : https://docs.microsoft.com/en-us/azure/kusto/query/prevfunction
- next: https://docs.microsoft.com/en-us/azure/kusto/query/nextfunction
- datetime_diff: https://docs.microsoft.com/en-us/azure/kusto/query/datetime-difffunction
- arg-max: https://docs.microsoft.com/en-us/azure/kusto/query/arg-max-aggfunction
- make_list: https://docs.microsoft.com/en-us/azure/kusto/query/makelist-aggfunction


