This article shows how to use Office 365 message trace to analyze email activity and detect various security use cases like data exfiltration in Azure Sentinel.
Office 365 Message Trace contains lots of information that can be useful for security analyst. While it doesn’t include message content itself, it can provide interesting information about mail flow in the organization. It can be also used to detect malicious activity and generate interesting reports about mail-flow (e.g information about bulk mail, spoofed domain emails or detecting abnormal rate of e-mail sending). Especially abnormal rate of e-mail sending can be used to detect malicious data exfiltration from within the organization. In this article we will describe how we can use Office 365 Message Trace and Azure Sentinel to detect these security scenarios.
Accessing Office 365 Message Trace
Office 365 Message Tracking logs can be accessed directly through web interface in Security & Compliance Center or Powershell (via Get-MessageTrace cmdlet). Additionally for programmatic access there’s also Office 365 Message Trace Reporting Web Service – we will be using this service in the article. It can be accessed through REST URI at https://reports.office365.com/ecp/reportingwebservice/reporting.svc/MessageTrace?. By default, it returns 30 days of message trace data. To filter results you can provide additional parameters in the URI – e.g. as in below example where we are looking for data within 2 days timeframe. Also note, that if you provide StartDate you also need to provide EndDate.
Office 365 Message Trace can be queried in the web interface for up to 30 days of data. If the reporting service is queried for longer period than 30 days, it will return empty dataset. Also, while all data about messages is available as soon as they are sent or received, it can take up to 24 hours until they are available through reporting service.
Creating Service Account
Before accessing Office 365 Message Trace service we need to create Office 365 service account. This account needs to have very strong password (as there’s no OAuth 2.0).
Service account can be created in Office 365 Security & Compliance Center or with Powershell. In order to manage Office 365 with PowerShell module, you need to follow steps in Connect to Office 365 Powershell.
Here’s the cmdlet to create the service user:
$TenantDomain = (Get-MsolAccountSku).AccountSkuId[0].Split(“:”)[0] + “.onmicrosoft.com”
$UserName = “msgtracereporting@”+$tenantdomain
$Pwd = “O365Msg-TracE”
New-MsolUser -UserPrincipalName $UserName -DisplayName “Message Trace Reporting” -Password $Pwd -ForceChangePassword $False -PasswordNeverExpires $True -UsageLocation “NL”
$RoleGroup = New-RoleGroup -Name “Message Trace Reporting” -Roles “Message Tracking”, “View-Only Audit Logs”, “View-Only Configuration”, “View-Only Recipients” -Members $UserName
Once you have the service account created, you can test the service by running simple curl command:
curl -v –user msgtracereporting@tenantdomain:password “https://reports.office365.com/ecp/reportingwebservice/reporting.svc/MessageTrace?\$filter=StartDate%20eq%20datetime’2020-02-01T00:00:00Z’%20and%20EndDate%20eq%20datetime’2020-02-06T00:00:00Z‘”
By default, Office 365 Reporting Service will return XML dataset, but you can change the resultset to JSON by specifying it in the Header request. We will be working with JSON dataset as Azure Sentinel works by default with JSON. Also, Logic Apps has better support for JSON than for XML. To get JSON data just include -H “Accept: application/json” in the curl command.
Creating Logic Apps playbook
We will be retrieving and ingesting data into Sentinel through Logic Apps playbook.
Note: there are other ways how message trace data can be ingested – e.g. through using Logstash, custom function or creating scheduled job that will ingest data through Sentinel HTTP Data Collection API.
Now, let’s go through Logic App Playbook creation. First, create new playbook in the Azure Sentinel Playbooks section, chose resource group and location.
Next, we need to choose the playbook trigger. We will be using Logic Apps scheduled trigger. We will set to run the trigger in daily interval, but you can chose any period, just remember the maximum 30 days interval to get the message trace.
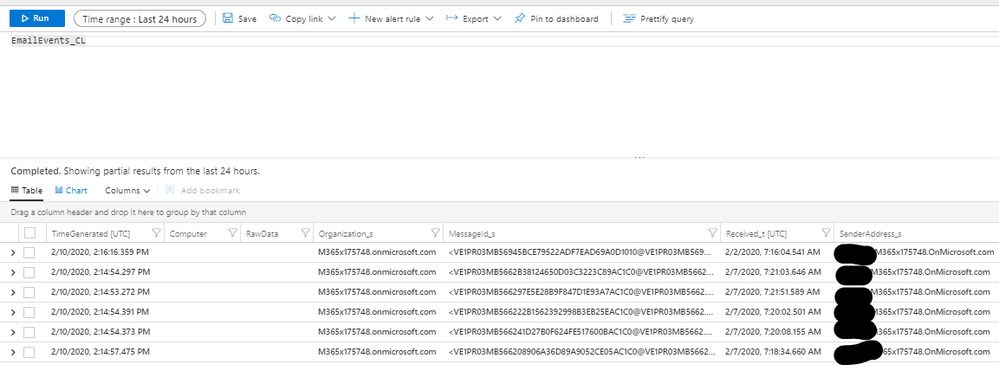
Message Trace table data will be ingested into EmailEvents custom logs table (EmailEvents_CL). We will be referencing this table thorough the article.
As playbook will be running in scheduled interval, we need to address what is the data interval to be queried during each playbook execution. The simple approach would be to take always the period of playbook execution – i.e. if we know the playbook runs every 24 hours, we would always request the 24 hours old data from message trace – interval of <(now()-1d), now()>. But this approach doesn’t provide the most flexible approach – i.e. if we decide to change the playbook interval (e.g. to 48 hours), we also need to update code of data retrieval in playbook itself. Also, if we will be doing any troubleshooting and we will need to rerun playbook, we can end up in having duplicate data ingested into the message trace table. And as Azure Sentinel doesn’t provide option how to delete data (it’s a SIEM), we need to be careful on how we are doing data ingestion.
The more accurate approach for data retrieval is based on timestamp of the latest ingested message trace, and querying data from this timestamp . In order to avoid empty dataset in potentially rare situation when the latest message is older than 30 days (as mentioned the reporting service will return data only within 30 days timeframe), we will query from interval as function of min(latest_ingested_message _timestamp, 30 days).
To retrieve timestamp of the latest ingested message, we will run the following KQL query:
EmailEvents | summarize arg_max(Received_t, Received_t) | project Received_t
Note: we are using arg_max function, returning only the largest value, and then projecting against this value to get single result.
Now we get the min(latest_ingested_message _timestamp, 30 days) and run fuzzy logic with isfuzzy = true operator to ensure the query won’t fail if the table doesn’t exist yet. As we are using isfuzzy=true, this query will also succeed when the EmailEvents table is not yet created (first Playbook execution)
The final query:
union isfuzzy=true
(print Received_t=(now()-30d)), //querying max 30 days ago
(EmailEvents_CL | summarize arg_max(Received_t, *)) //latest message
| summarize max(Received_t)
| project max_Received_t = (max_Received_t + 1ms)
We will now add into playbook Run Query and list Results action to execute the query:
Calling Office 365 Message Reporting Service
After we have the timestamp of the latest message, we can now call the Office 365 Message Trace Service.
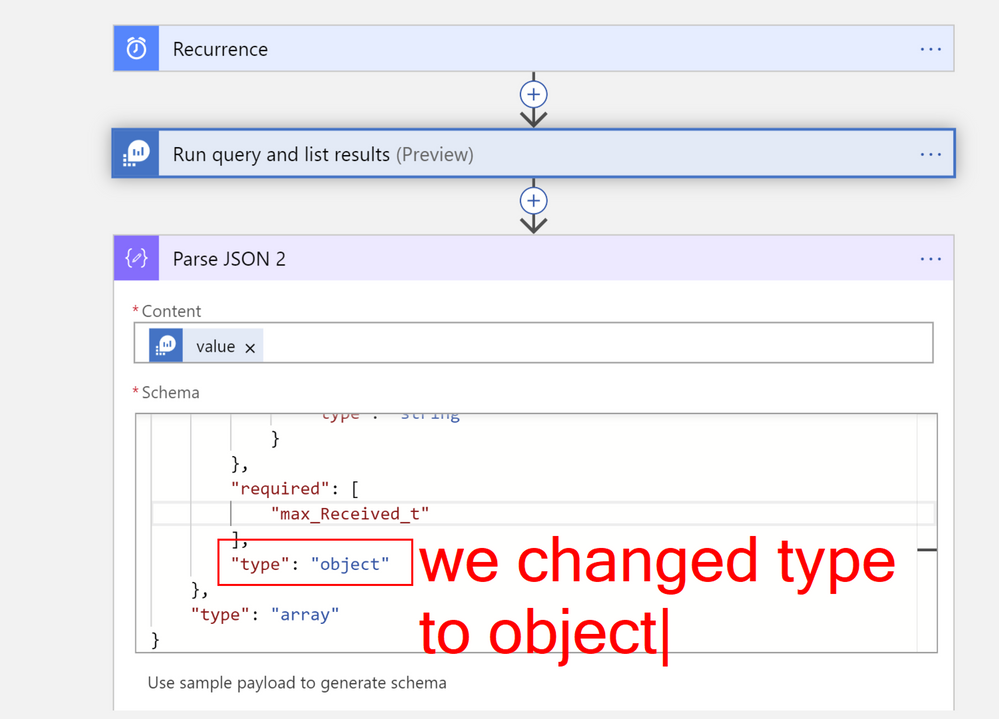
First, we need to parse the result of query execution in previous step. We will be using Parse Json action with default schema generated from the return value of query function. We just changed type from array to object under items property. As we know we are querying for single value, we can conveniently change the type to object, which will return single item rather than array with one item.
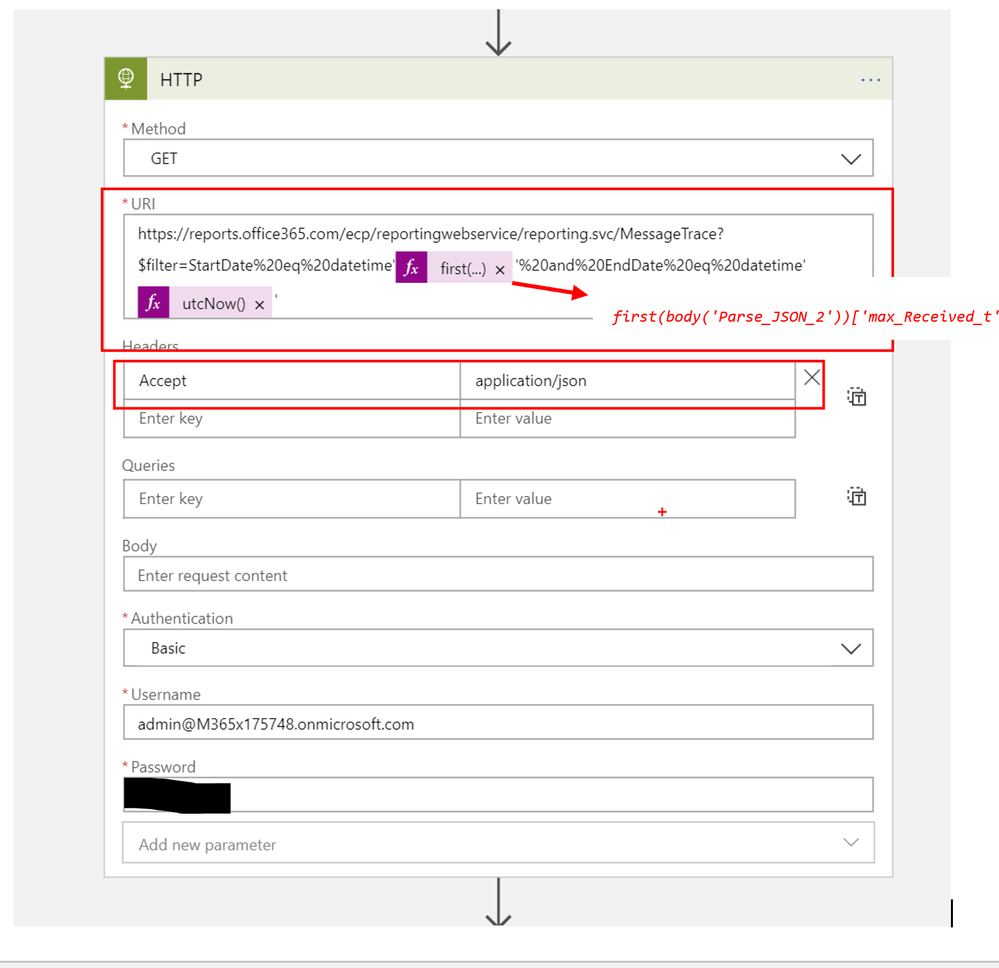
To call the O365 Message Trace Reporting Service we will use HTTP function in Logic Apps. We will be also adding JSON into Headers section to retrieve data in JSON format instead of XML:
Also notice the expression we added for the most recent timestamp we queried in previous step and utcnow() function to refer to current data.
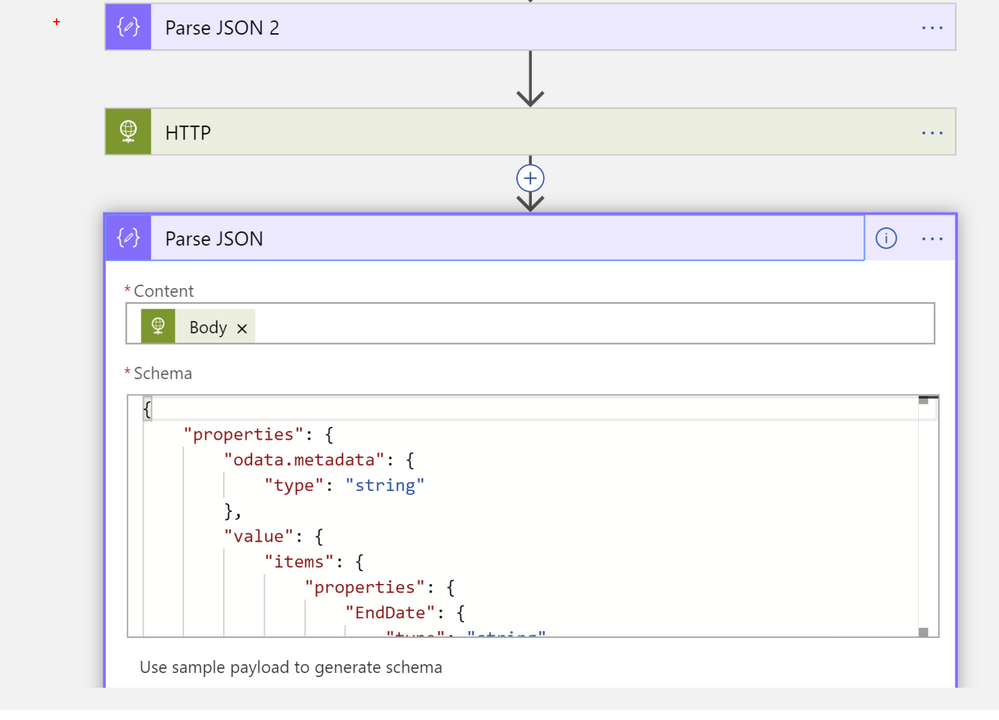
After we retrieve message trace data, we will ingest them into Azure Sentinel. Before we ingest data, we parse the result set from HTTP service query against O365 reporting service using another Parse_JSON function:
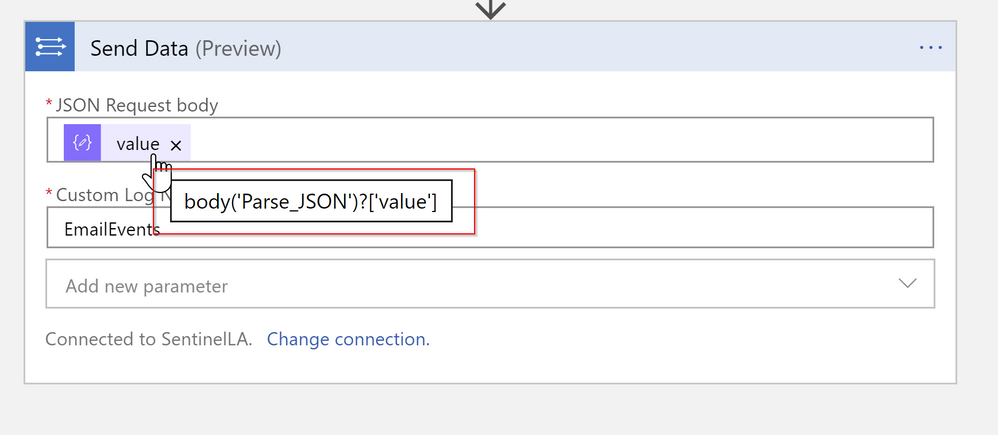
For data ingestion we will be using Send Data function from Log Analytics function list. Note that by default this function will produce for-each loop if you input array as a parameter. As Send Data function supports ingesting large JSON array at once, we can avoid for-each cycle (also each for-each cycle generates additional logic app cost), and ingest all retrieved messages at once. To do so just add “value” request into SendData action. You may not see “value” immediately in the list of dynamic properties – if in this case just type into expression dialog body(‘Parse_JSON’)?[‘value’].
Important note: Send Data function has 30MB limit for data ingestion, so in case your playbook will fail due to large data set, you can increase the playbook recurrence interval.
And here’s the resultset after Message Trace ingestion into EmailEvents table:
Detecting Data Exfiltration
After we have ingested data from Office 365 Message Trace into Azure Sentinel, we can start do querying and preparing security use cases. One of the common use case across organization is to detect data exfiltration. One indicator of data exfiltration is sending large amount of data in a short timeframe.
Note: in following queries please replace article’s tenant name m365x175748.onmicrosoft.com with your Office 365 domain/tenant name. If you are using multiple domain names, for each of the domain add additional operator into the query.
To detect data exfiltration, we will form KQL query –
First, we will create query that will calculate baseline for #of sent messages:
let sending_threshold = toscalar(
EmailEvents_CL
| where Received_t >= startofday(ago(7d)) and Received_t < startofday(now())
| summarize cnt=count() by SenderAddress_s, bin(Received_t, 1d)
| summarize avg(cnt), stdev(cnt)
| project threshold = avg_cnt+stdev_cnt);
print sending_threshold
After sending_threshold is calculated, we can now form full query that will check for specific deviations from the threshold. For more details how this query was formulated check one of the recent Azure Sentinel webinar on rules creation at https://aka.ms/SecurityWebinars.
let sending_threshold = toscalar(
EmailEvents_CL
| where Received_t >= startofday(ago(7d)) and Received_t < startofday(now()) and RecipientAddress_s !endswith “m365x175748.onmicrosoft.com”
| summarize cnt=count() by SenderAddress_s, bin(Received_t, 1d)
| summarize avg(cnt), stdev(cnt)
| project threshold = avg_cnt+stdev_cnt);
EmailEvents_CL
| where Received_t >= ago(1d)
| summarize count() by SenderAddress_s
| where count_ > sending_threshold
Once we have the query, we can create Sentinel alert rule and start being alerted about anomalous data exfiltration.
Additional information from Office 365 Message Trace
Top 10 senders by message count:
EmailEvents_CL
| summarize Amount=count() by SenderAddress_s
| top 10 by Amount
Top 10 recipients by message count:
EmailEvents_CL
| summarize Amount=count() by RecipientAddress_s
| top 10 by Amount
Mail Flow over time:
EmailEvents_CL
| summarize count() by bin(Received_t, 30m)
| render timechart
Summary of internal/external inbound vs. outbound email:
EmailEvents_CL
| summarize InternalEmail = countif(SenderAddress_s endswith “m365x175748.onmicrosoft.com” and RecipientAddress_s endswith “m365x175748.onmicrosoft.com” ), OutboundEmail = countif(SenderAddress_s endswith “m365x175748.onmicrosoft.com” and RecipientAddress_s !endswith “m365x175748.onmicrosoft.com” ), InboundEmail= countif(SenderAddress_s !endswith “m365x175748.onmicrosoft.com” and RecipientAddress_s endswith “m365x175748.onmicrosoft.com” ) by bin_at(Received_t, 1h, now())
| render timechart
Top 10 largest email messages by message size:
EmailEvents_CL
| top 10 by Size_d
Also, we can use Message Trace data to check if organization has received any e-mail from domain-like email address (e.g. contoso.com vs c0nt0so.om). This can be indicator of phishing attack. One of the option how to do it is to use the tool like dnstwist (there’s also online version at https://dnstwister.report/) to generate list of valid and possible permutations of your domain, store it as a lookup table and then use it in the query joining the data from the EmailEvents table (more about how to use lookup table with Azure Sentinel).
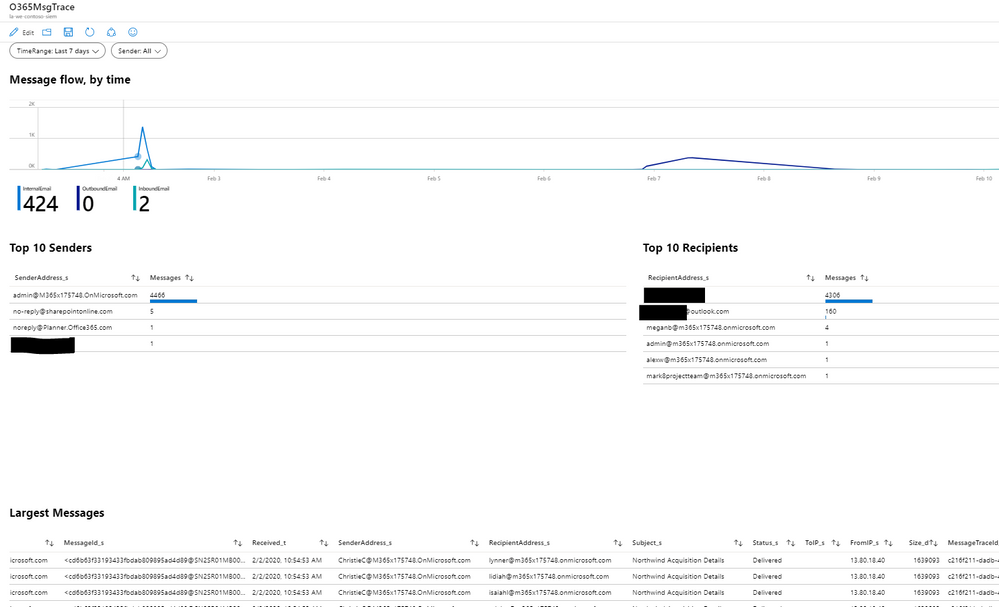
We have also created sample workbook for security analysts based on queries described above:
Summary
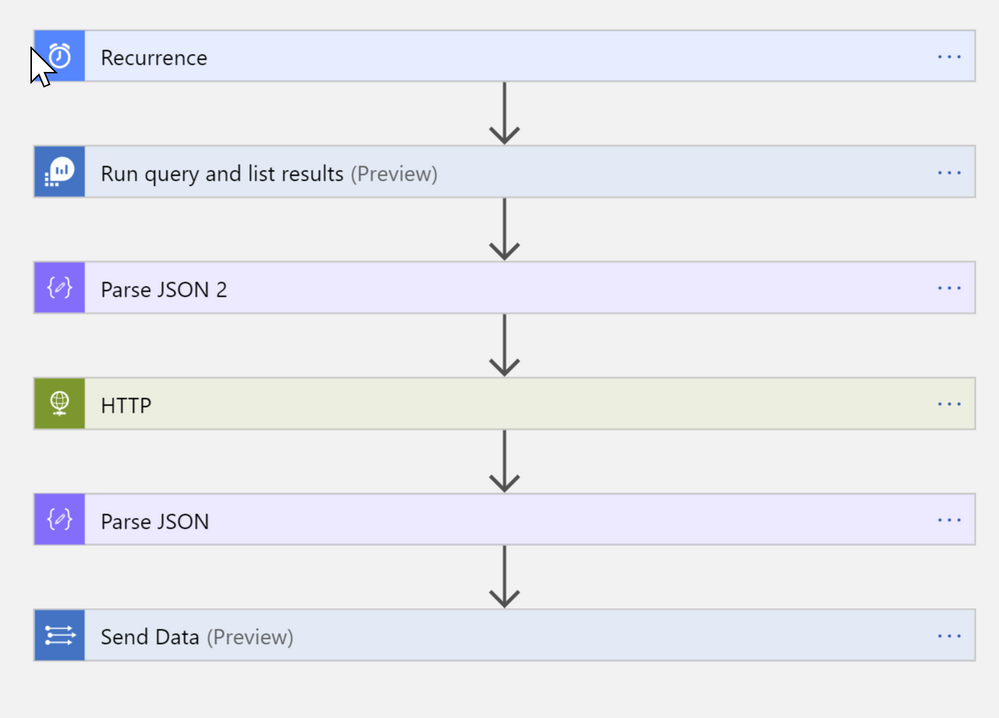
This article has demonstrated how to ingest Office 365 Message Trace logs into Sentinel. Office 365 Message Trace provides underlying data for various interesting security scenarios and use cases like data exfiltration. Here’s also the final Logic Apps playbook for reference:

