This post has been republished via RSS; it originally appeared at: AzureCAT articles.
This blog post explains how to use the recently published Azure Backend Listener for Apache JMeter to send your test result metrics to your Azure Application Insights instance.
With the release of JMeter 3.2, the Apache team introduced a new BackendListener interface that allows you to build your own listeners and asynchronously push test result metrics to a backend of your choice.
This Application Insights integration leverages the JMeter Backend Listener interface by implementing an AzureBackendListenerClient. This implementation makes use of the telemetry client available in the Application Insights SDK for Java to send metrics to Azure.
Step-by-step with the Azure Backend Listener
This section shows you how to push your test results metrics to Application Insights. The configuration steps use the JMeter UI, but you can also do this via the command line.
1. Create an Application Insights instance
The first step is to create an Application Insights instance from the portal. Take note of the instrumentation key, which you need to use later on to tell the backend listener where to push the metrics.
2. Install Java
JMeter is a Java application, so you must install the Java Virtual Machine before you install JMeter. You can check if Java is already installed in your system by opening a command line console and typing java -version. For example:
C:\> java -version
java version "1.8.0_241"
Java(TM) SE Runtime Environment (build 1.8.0_241-b07)
Java HotSpot(TM) 64-Bit Server VM (build 25.241-b07, mixed mode)
If you get an output like the one above, Java is already present and you can proceed with JMeter installation. Otherwise, if you get a message like 'java' is not recognized..., you can download and install the latest Java SE Runtime Environment 8 for your system.
3. Install JMeter
Now you can download the latest Apache JMeter binaries from the official site and uncompress it to a location of your choice.
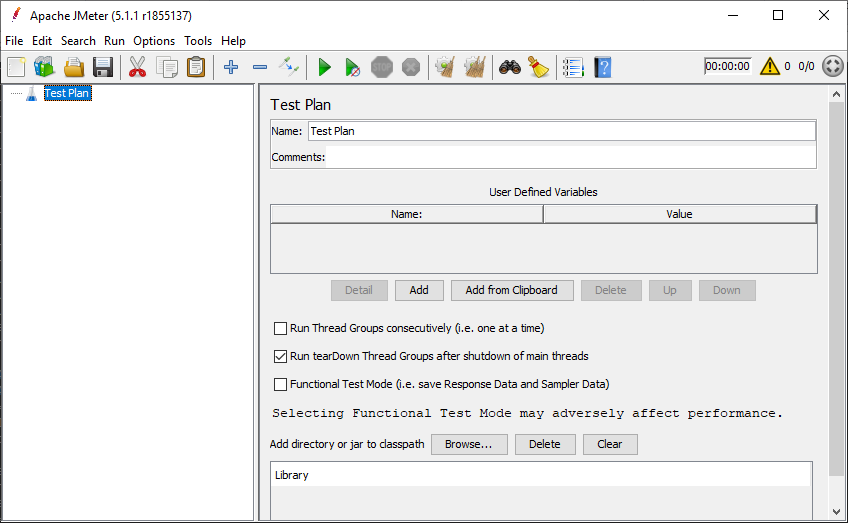
Navigate to the JMeter directory and make sure JMeter is able to start. To run JMeter, browse to the bin/ directory and run jmeter.bat (if you are on Windows) or jmeter.sh (if you are on Linux). The JMeter Test Plan screen appears.
4. Install the plugin
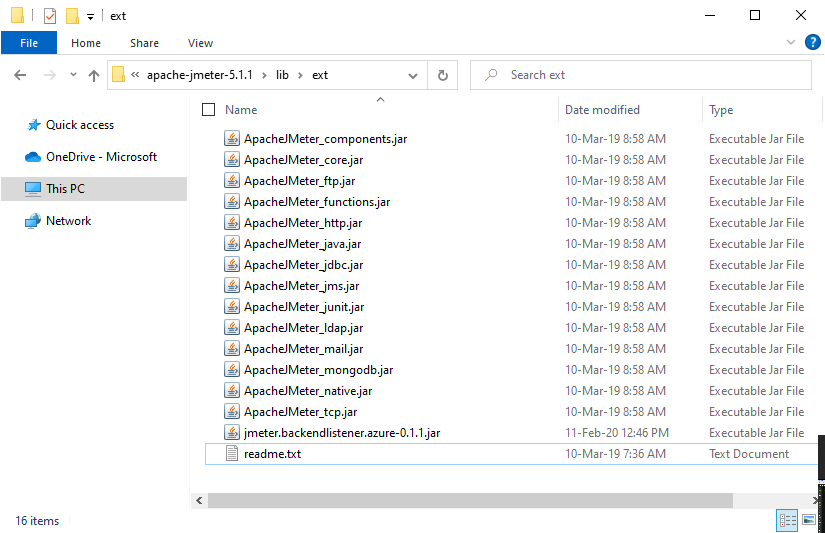
Go to the GitHub releases for the Azure backend listener and download the JAR file for the latest release. The required JAR file has the jmeter.backendlistener.azure-X.Y.Z.jar format.
Move the JAR file to the JMeter directory inside the lib/ext/ directories. Your ext directory should look something like this:
Close JMeter if it is running and open it again to reload the installed plugins.
5. Configure the plugin
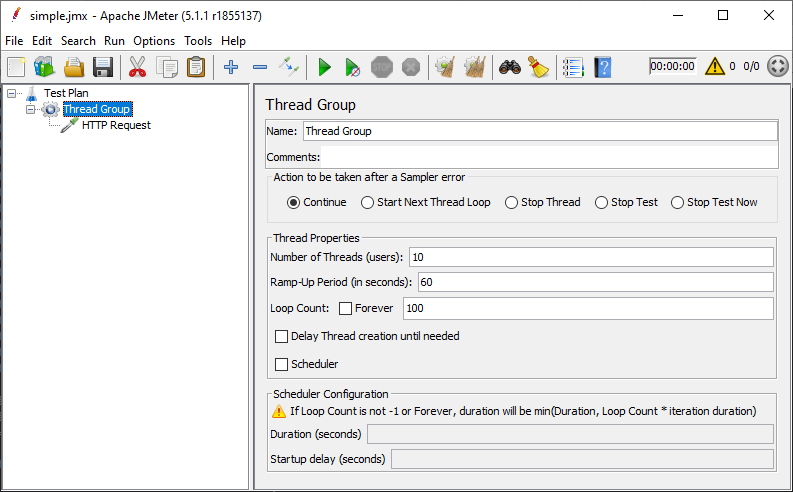
If you have an existing JMeter test plan file, you can go ahead and load it. Otherwise, you can download a simple test plan to try the plugin. This test plan sends 100 HTTP requests to http://bing.com from 10 threads over approximately 60 seconds, making a total of 1,000 requests.
Once loaded, JMeter should look like this:
To make JMeter send test result metrics to your Azure Application Insights instance, in your Test Plan, right-click Thread Group > Add > Listener > Backend Listener, and choose io.github.adrianmo.jmeter.backendlistener.azure.AzureBackendClient from the Backend Listener implementation dropdown list.
Then, in the Parameters table, configure the following attributes.
| Attribute | Description | Required |
| instrumentationKey | The Instrumentation Key of your Application Insights instance | Yes |
| testName | Name of the test. This value is used to differentiate metrics across test runs or plans in Application Insights and allow you to filter them. | Yes |
| liveMetrics | Boolean to indicate whether or not real-time metrics are enabled and available in the Live Metrics Stream. Defaults to true. | Yes |
Example of configuration:
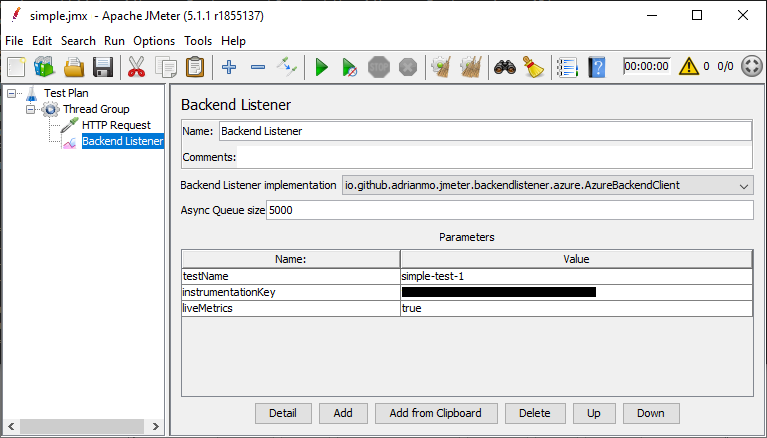
This example sets the testName to simple-test-1 and will provide us with real-time metrics via Live Metrics Stream.
6. Run your test plan
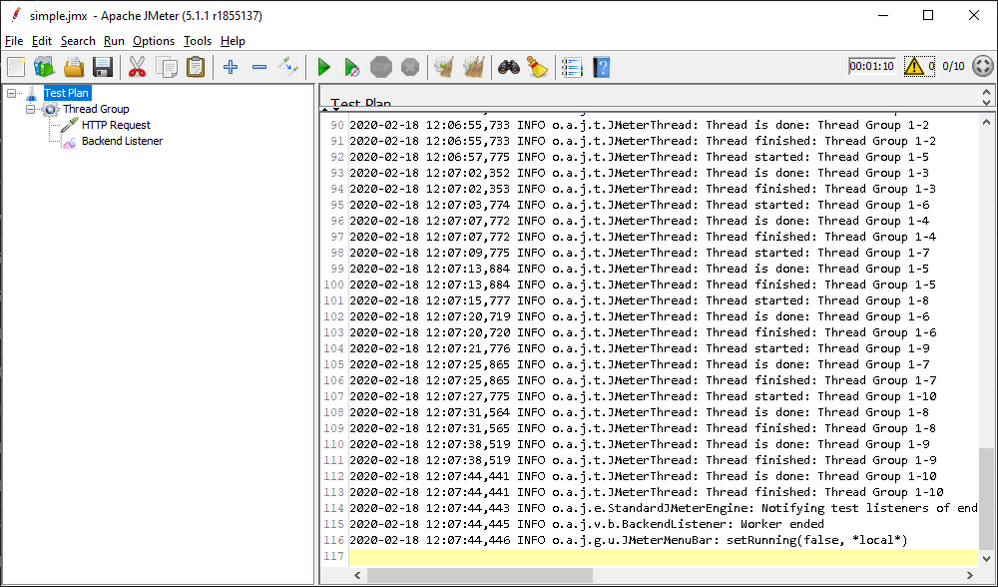
Once the configuration is in place, you can run your test plan. Click the play/start button to start the test plan. The Azure Backend Listener starts pushing metrics, which are collected in your Application Insights instance under the requests dimension and with the name simple-test-1.
Check the JMeter logs to make sure no error is thrown.
7. Visualize test result metrics
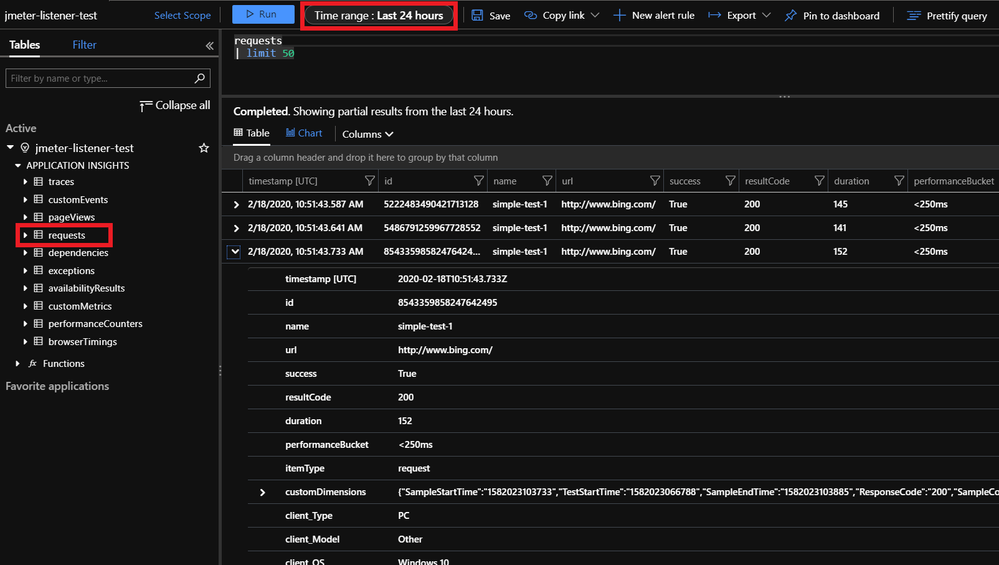
After approximately one minute, the test finishes and you can check to see if your metrics are available in Application Insights. In the Azure portal, go to your Application Insights instance and go to Monitoring > Logs. Double-click the requests dimension to browse the metrics sent by JMeter. If you don’t see the metrics, wait a few more minutes until they appear. Make sure to also check the additional metrics available inside the customDimensions.
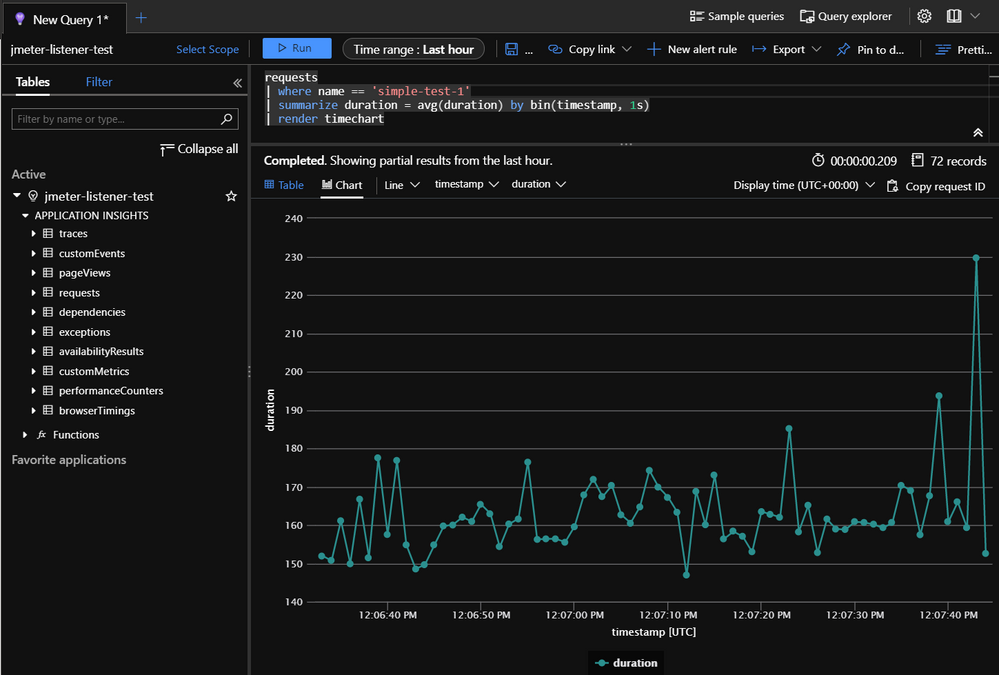
You can also create custom charts to visualize your metrics. For example, the following KQL query depicts the requests' duration during the test run. Make sure to adjust the time range to include your metrics.
requests
| where name == 'simple-test-1'
| summarize duration = avg(duration) by bin(timestamp, 1s)
| render timechart
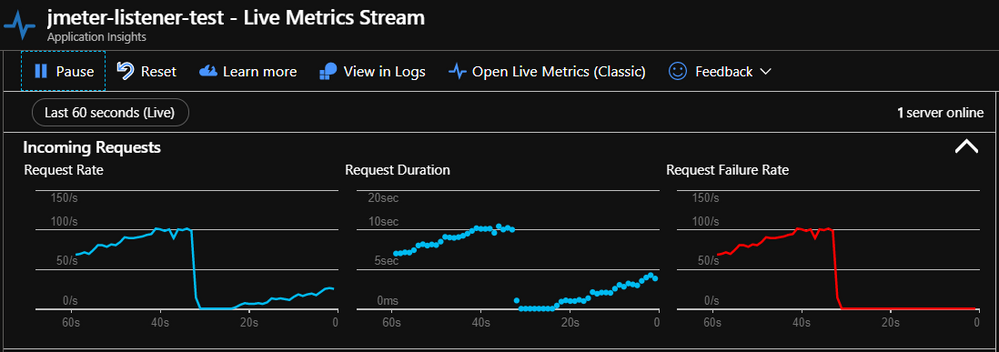
Additionally, if you enabled liveMetrics in the configuration, you can watch your test performance in real-time in the Live Metrics Stream blade.
Feedback and contributions
If you have experienced any issues during the setup or usage of the plugin, or have any ideas for future enhancements, please let us know in the project's GitHub issues section. We also encourage direct contributions to the project by forking and making pull requests.
