This post has been republished via RSS; it originally appeared at: New blog articles in Microsoft Tech Community.
A dashboard visually summarizes all the important metrics you have selected to track, to give you a quick-and- easy overview of where everything stands. With real-time Dashboard, it’s a live view of exactly how your application information is performing. This helps in better decision making and helps in taking proactive actions. These can help in the downtime.
This blog explain how you can use the Azure Log Analytics to create a custom Dashboard for Azure Database for MySQL
This is a starter guide. You can use these ideas and customize as per your need.
Steps
- Create a Custom Azure Dashboard in the portal
- Configure the Databases for Data Collection
- Send this information to Log Analytics
- Select the objects which you would like to see in Dashboard.
- Add the Metrics selected.
- Write Kusto Query to get the required information
- Tag it to the Custom Dashboard.
1. Create Custom Azure Dashboard
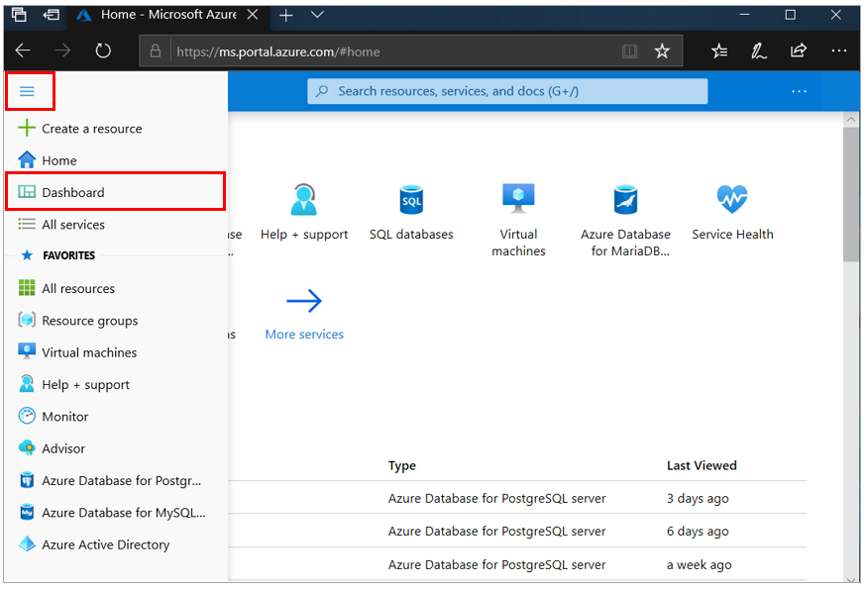
Log in to the Azure portal
Select Dashboard to open your default dashboard.
Select New Dashboard
Give the Name for your Dashboard and Say Done Customizing for now
For more details on how to create a Dashboard you can refer to:
https://docs.microsoft.com/azure/azure-portal/azure-portal-dashboards
When you create a dashboard, it is private by default, which means you are the only person who can see it. To make it visible to others, use the Share button that appears alongside the other dashboard commands. You are asked to choose a subscription and resource group for your dashboard to be published to.
Select the Subscription Name where you would like to share and select Publish , below
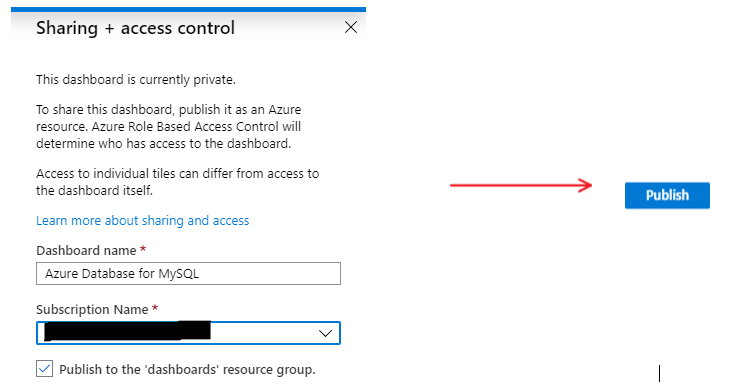
- Metric are available by default. There is no specific configuration needs to be done. The Metrics available for Azure Database for MYSQL are documented in the article below: https://docs.microsoft.com/azure/mysql/concepts-monitoring
- In case of extra data like audit logs , slow query logs , query store etc. we would have to configure the settings in the server parameters of the corresponding Azure Database for MySQL/MariaDB
- Slow query logs : By default the slow query log is disabled. To enable it, set slow_query_log to ON. There are other parameters which you can adjust. Details in the link https://docs.microsoft.com/azure/mysql/concepts-server-logs
- Audit logs : By default the audit log is disabled. To enable it, set audit_log_enabled to ON. There are other parameters which you can adjust. Details in the link https://docs.microsoft.com/azure/mysql/concepts-audit-logs
Depending on what needs to be seen in the dashboard, we can configure the service. Once we configure the required service parameters, we would need to configure Diagnostic logs.
3.Send this information to Azure Monitor Logs (Log Analytics)
Azure Database for MySQL is integrated with Azure Monitor diagnostic settings. Through this service, logs and metrics can be emitted to Azure Monitor Logs, Event Hubs, or Azure Storage. For our scenario we will send to Azure Monitor Logs (also known as Log Analytics).
You would see under each Azure Database service under Monitoring session
Select Diagnostics setting and then select Add diagnostic setting
Select the necessary Data you would like to upload to the Azure Monitor Logs .
If you have not created a Log Analytics work space, you will have to create one. You can refer to: https://docs.microsoft.com/en-us/azure/azure-monitor/learn/quick-create-workspace
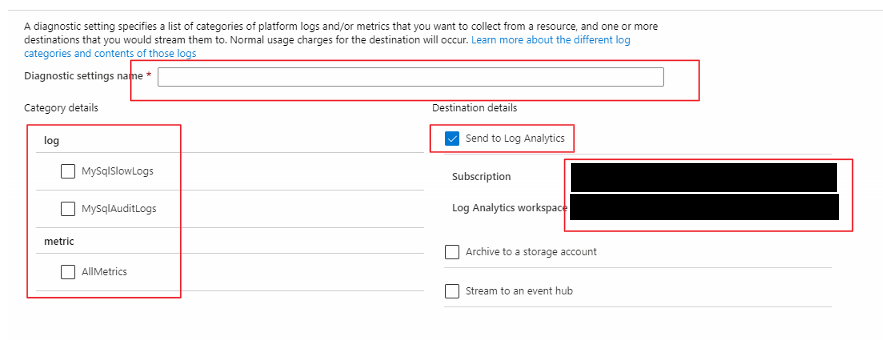
Add the Metrics selected.
Go to the Dashboard again from the portal
Select the custom Dashboard we created initially and click on Edit
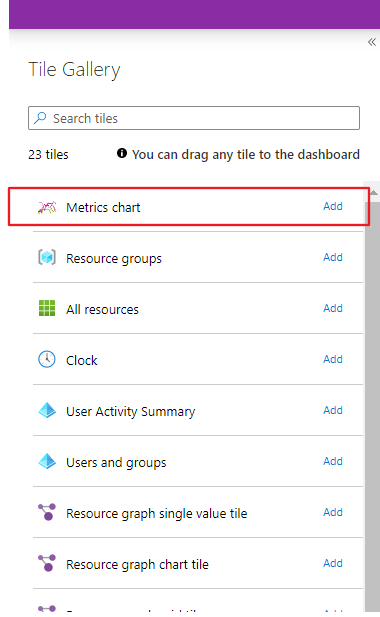
Click on Add Metrics Chart
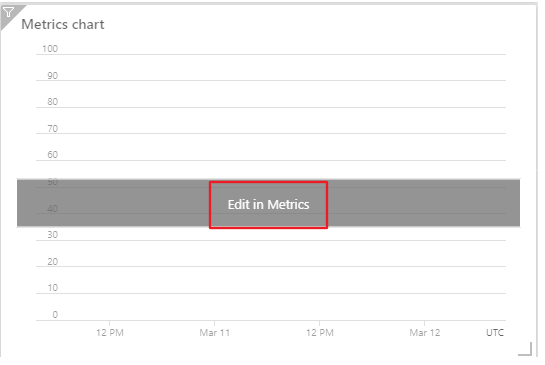
Click on done Customizing and once you are back on the page go ahead and click "Edit in Metrics"
Select Add Metric
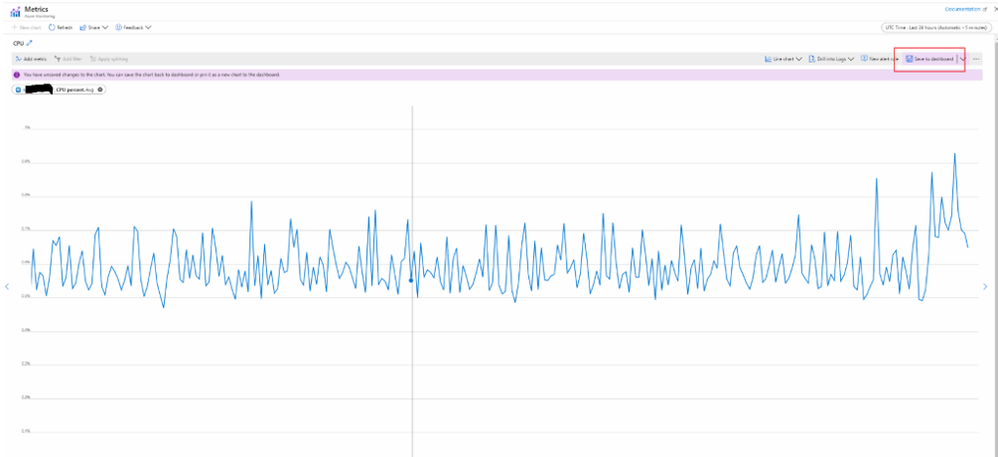
You can add multiple metrics for the same MySQL server in one chart. You could also have multiple MySQL servers listed for the same metric.
Once the necessary metrics are added, Select Save to Dashboard.
In the above we have added two Azure Database for MySQL server's CPU Avg.
Following the same steps, you can create multiple Chart of your choice.
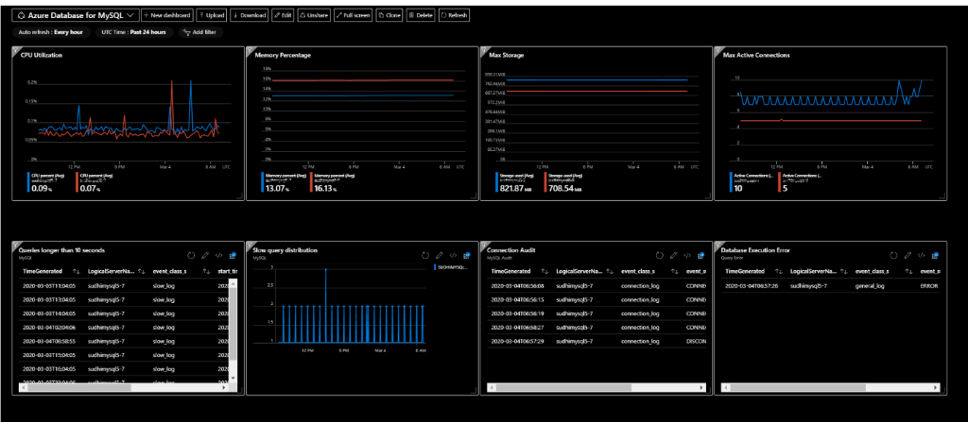
For our example I took Avg CPU, Avg Memory, Max Storage, Max Active Connections.
Now let’s see how we have bring the other data we send to log analytics to the dashboard. I will take here one example to get data from the slow query logs
For the same we would have to first go to Monitor from the portal. Select Logs and click on Get Started
Select the scope. (I selected MySQLserver ) (This is only if you doing for first time). Later it can directly take you to Kusto Query Explorer
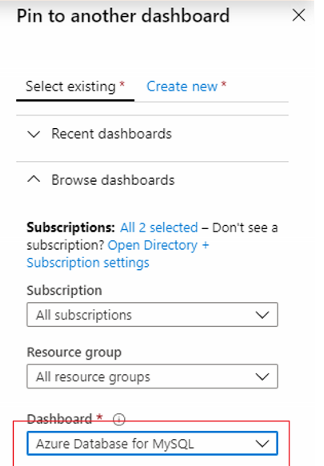
Once you have finalized on the query you can run and then once you have result you should be able to pin to dashboard.

I have picked this query from Slow query logs link "Queries longer than 10 seconds on a particular server"
AzureDiagnostics
| where LogicalServerName_s == '<Server Name>'
| where Category == 'MySqlSlowLogs'
| project TimeGenerated, LogicalServerName_s, event_class_s, start_time_t , query_time_d, sql_text_s
| where query_time_d > 10
Once Pin to Dashboard is selected, you will be able to see the Dashboard if it is Shared one.
I followed the same procedure for Audit and Query Store to get that information pin to Dashboard.
Slow query distribution
AzureDiagnostics
| where LogicalServerName_s == '<Server Name>'
| where Category == 'MySqlSlowLogs'
| project TimeGenerated, LogicalServerName_s, event_class_s, start_time_t , query_time_d, sql_text_s
| summarize count() by LogicalServerName_s, bin(TimeGenerated, 5m)
| render timechart
Audit for connection to DB
AzureDiagnostics
| where LogicalServerName_s == '<Server Name>'
| where Category == 'MySqlAuditLogs'
| where event_subclass_s in ('CONNECT','DISCONNECT')
| project TimeGenerated, LogicalServerName_s, event_class_s,event_subclass_s,user_s
Database Execution Error
AzureDiagnostics
| where LogicalServerName_s == '<Server Name>'
| where Category == 'MySqlAuditLogs'
| where event_subclass_s == "ERROR"
| project TimeGenerated, LogicalServerName_s, event_class_s,event_subclass_s,user_s
Once you pin this to the Dashboard you can go ahead and edit it. You can make the layout look better.
The Dashboard would like this.
Hope this helps
Sudheesh Narayanaswamy

