One of Azure Sentinel’s key strength’s is its ability to ingest data whether that data lives On-Prem or in the cloud. For this use-case, I will show you how incredibly easy it is to install ‘auditd’, configure ‘auditd rules’, attach PAM to a user’s TTY session and log the users TTY session activity into the /var/log/audit/auditd.log that we will be ingesting into Azure Sentinel using the Azure OMS agent for Linux. Then with this data in Azure Sentinel, I will walk through how to create an Analytic Detection you may want to consider when monitoring Production Linux Servers and VM’s.
Install & Configure ‘auditd’
For this use-case I am using an Ubuntu 18.04 VM and ‘auditd’ does not come pre-installed within the Ubuntu OS. That being said, the packages are included in the standard repos and we can install the Linux Audit System on our Ubuntu 18.04 VM with the following command:
# apt install -y auditd
Once you run the above command, your screen will look something like this:
Reading package lists… Done
Building dependency tree
Reading state information… Done
The following packages were automatically installed and are no longer required:
  grub-pc-bin linux-headers-4.15.0-72
Use ‘apt autoremove’ to remove them.
The following additional packages will be installed:
  libauparse0
Suggested packages:
  audispd-plugins
The following NEW packages will be installed:
  auditd libauparse0
0 upgraded, 2 newly installed, 0 to remove and 0 not upgraded.
Need to get 242 kB of archives.
After this operation, 803 kB of additional disk space will be used.
Get:1 http://azure.archive.ubuntu.com/ubuntu bionic/main amd64 libauparse0 amd64 1:2.8.2-1ubuntu1 [48.6 kB]
Get:2 http://azure.archive.ubuntu.com/ubuntu bionic/main amd64 auditd amd64 1:2.8.2-1ubuntu1 [194 kB]
Fetched 242 kB in 0s (2116 kB/s)
Selecting previously unselected package libauparse0:amd64.
(Reading database … 74436 files and directories currently installed.)
Preparing to unpack …/libauparse0_1%3a2.8.2-1ubuntu1_amd64.deb …
Unpacking libauparse0:amd64 (1:2.8.2-1ubuntu1) …
Selecting previously unselected package auditd.
Preparing to unpack …/auditd_1%3a2.8.2-1ubuntu1_amd64.deb …
Unpacking auditd (1:2.8.2-1ubuntu1) …
Setting up libauparse0:amd64 (1:2.8.2-1ubuntu1) …
Setting up auditd (1:2.8.2-1ubuntu1) …
Created symlink /etc/systemd/system/multi-user.target.wants/auditd.service → /lib/systemd/system/auditd.service.
Processing triggers for systemd (237-3ubuntu10.33) …
Processing triggers for man-db (2.8.3-2ubuntu0.1) …

Progress: [ 91%] [#################################################################################################################################################################################################………………..]
Now that ‘auditd’ is installed on our Ubuntu VM, we look at configuring the /etc/audit/audit.rules file that contains the rules ‘auditd’ considers for monitoring.
Should you need additional help troubleshooting your /etc/audit/audit.rules configuration, check out this link: http://manpages.ubuntu.com/manpages/bionic/man7/audit.rules.7.html
For this use-case, I will be using the audit.rules found at GitHub – auditd-attack.rules that use the MITRE ATTACK kill chain to call out activities mapped to specific TTP’s. As you may or may not know, Azure Sentinel uses the MITRE ATTACK kill chain to map Analytics/Detections & Hunt Queries to these TTP’s to help Analyst’s quickly identify IOC’s within a mapped TTP. When combined with Entity Mapping, this gives Azure Sentinel a leg up helping Analyst’s understand the depth and breadth of an attack providing a holistic approach as Analytics and Entities are mapped together.
Most Linux services like ‘auditd’ use a sub-directory to keep persistence with rules/settings added by using separate rule files. To accommodate, we need to create a new rules file and we want to use the contents from GitHub to drop in the rule contents. This ensures that the both the MITRE ATTACK and OMS rules continue to persist. My advice is to pick and choose/edit the MITRE ATTACK rules that will provide you with the desired visibility into specific TTP’s. Here are the GitHub – auditd-attack.rules again for your reference.
- Use the ‘touch’ command to create the mitre_attack.rules file
- Use a text editor, (I like using ‘vim’) to copy paste in the relevant rules you have chosen to apply and monitor.
# touch /etc/audit/rules.d/mitre_attack.rules
# vim /etc/audit/rules.d/mitre_attack.rules
Copy and paste in rules found in the GitHub link auditd-attack.rules.
Ok, so that was a lot of copy paste into your mitre_attack.rules file. With our updated rules file in place, we now need to restart ‘auditd’. Lets run the following command:
# service auditd restart
The easiest way to validate your updated rules is to cat/grep the /var/log/audit/audit.log for any of the TTP’s you added to the audit.rules file. Here is an example:
# tail -f /var/log/audit/audit.log | grep T1
You should see output like the following:
type=SYSCALL msg=audit(1580291194.240:23096492): arch=c000003e syscall=257 success=yes exit=4 a0=ffffff9c a1=7f67eb76e901 a2=0 a3=0 items=1 ppid=1605 pid=76691 auid=4294967295 uid=0 gid=0 euid=0 suid=0 fsuid=0 egid=0 sgid=0 fsgid=0 tty=(none) ses=4294967295 comm=”sshd” exe=”/usr/sbin/sshd” key=”T1016_System_Network_Configuration_Discovery“
type=SYSCALL msg=audit(1580291194.848:23096493): arch=c000003e syscall=106 success=no exit=-1 a0=0 a1=6d a2=6d a3=7f67e86d8330 items=0 ppid=76691 pid=76692 auid=4294967295 uid=109 gid=65534 euid=109 suid=109 fsuid=109 egid=65534 sgid=65534 fsgid=65534 tty=(none) ses=4294967295 comm=”sshd” exe=”/usr/sbin/sshd” key=”T1166_Seuid_and_Setgid“
type=SYSCALL msg=audit(1580291194.848:23096494): arch=c000003e syscall=105 success=no exit=-1 a0=0 a1=0 a2=ffffffffffffffff a3=7f67e86d8330 items=0 ppid=76691 pid=76692 auid=4294967295 uid=109 gid=65534 euid=109 suid=109 fsuid=109 egid=65534 sgid=65534 fsgid=65534 tty=(none) ses=4294967295 comm=”sshd” exe=”/usr/sbin/sshd” key=”T1166_Seuid_and_Setgid“
type=SYSCALL msg=audit(1580291195.728:23096497): arch=c000003e syscall=257 success=yes exit=3 a0=ffffff9c a1=7fdcb4eea137 a2=0 a3=0 items=1 ppid=76693 pid=76695 auid=4294967295 uid=0 gid=999 euid=1 suid=0 fsuid=1 egid=0 sgid=999 fsgid=0 tty=(none) ses=4294967295 comm=”sudo” exe=”/usr/bin/sudo” key=”T1169_Sudo“
type=SYSCALL msg=audit(1580291195.728:23096498): arch=c000003e syscall=42 success=yes exit=0 a0=4 a1=7fdcb673abd4 a2=10 a3=d items=0 ppid=76693 pid=76695 auid=4294967295 uid=0 gid=999 euid=0 suid=0 fsuid=0 egid=0 sgid=999 fsgid=0 tty=(none) ses=4294967295 comm=”sudo” exe=”/usr/bin/sudo” key=”T1043_Commonly_Used_Port“
type=SYSCALL msg=audit(1580291195.732:23096499): arch=c000003e syscall=42 success=yes exit=0 a0=f a1=7ffece9f6da0 a2=10 a3=7ffece9f6d9c items=0 ppid=1 pid=89240 auid=4294967295 uid=101 gid=103 euid=101 suid=101 fsuid=101 egid=103 sgid=103 fsgid=103 tty=(none) ses=4294967295 comm=”systemd-resolve” exe=”/lib/systemd/systemd-resolved” key=”T1043_Commonly_Used_Port“
type=SYSCALL msg=audit(1580291195.732:23096500): arch=c000003e syscall=42 success=yes exit=0 a0=10 a1=7ffece9f6da0 a2=10 a3=7ffece9f6d9c items=0 ppid=1 pid=89240 auid=4294967295 uid=101 gid=103 euid=101 suid=101 fsuid=101 egid=103 sgid=103 fsgid=103 tty=(none) ses=4294967295 comm=”systemd-resolve” exe=”/lib/systemd/systemd-resolved” key=”T1043_Commonly_Used_Port“
type=SYSCALL msg=audit(1580291195.736:23096502): arch=c000003e syscall=105 success=yes exit=0 a0=0 a1=7 a2=7fdcb6746dd0 a3=7fdcb5ccf330 items=0 ppid=76693 pid=76695 auid=4294967295 uid=0 gid=999 euid=0 suid=0 fsuid=0 egid=999 sgid=999 fsgid=999 tty=(none) ses=4294967295 comm=”sudo” exe=”/usr/bin/sudo” key=”T1166_Seuid_and_Setgid“
Awesome! Our ‘auditd’ data is shaping up and now contains the MITRE ATTACK TTP’s mapped to the audit data being logged. Our next step is to add PAM TTY to complete our scenario and include the tty session data to our audit log.
Configure ‘PAM TTY module’
The pam_tty_audit PAM module is used to enable or disable TTY auditing. By default, the Ubuntu Linux
kernel does not audit input on any TTY. When you enable the module, the input is logged in the /var/log/audit/audit.log file, written by the auditd daemon. Note that the input is not logged immediately, because TTY auditing first stores the keystrokes in a buffer and writes the record periodically, or once the audited user logs out. The audit.log file contains all keystrokes entered by the specified user, including backspaces, delete and return keys, the control key and others. Although the contents of audit.log are human-readable it might be easier to use the aureport utility, which provides a TTY report in a format which is easy to read.
You can learn how to use the aureport utility here: https://access.redhat.com/documentation/en-us/red_hat_enterprise_linux/6/html/security_guide/sec-configuring_pam_for_auditing.
For this exercise, however we want to include user’s tty session activity to the ‘audit.log’ so that it will be mapped accordingly to the MITRE ATTACK TTP’s scoped within our audit rules file we created earlier. This will align all activity being logged through ‘auditd’ to our MITRE ATTACK rules and builds the foundation and enrichment into our audit.log data that we will need when we create our Analytics within Azure Sentinel.
There are 2 files we want to modify and add the pam_tty_audit.so reference line, they are as follows:
- /etc/pam.d/systemd-user
- /etc/pam.d/sshd
First lets edit the /etc/pam.d/systemd-user file. Again I will be using ‘vim’ but feel free to use an editor of your choosing.
# vim /etc/pam.d/systemd-user
Add the following line:
session required pam_tty_audit.so log_passwd
Next lets edit the /etc/pam.d/sshd file.
# vim /etc/pam.d/sshd
Add the following line:
session required pam_tty_audit.so log_passwdKeep in mind that within the Ubuntu OS, ‘auditd’ can be used to track user commands executed in a TTY. If the system is a server and the user logins through SSH, the pam_tty_audit PAM module must be enabled in the PAM configuration for sshd (the following line must appear in /etc/pam.d/sshd):
session required pam_tty_audit.so enable=*
Then, the audit report can be reviewed using the aureport command, e.g. tty keystrokes:
# aureport –tty
However, the above setup cannot audit users that switch to root using the sudo su – command. In order to audit all commands run by root, as referenced here, the following two lines must be added to /etc/audit/audit.rules:
-a exit,always -F arch=b64 -F euid=0 -S execve
-a exit,always -F arch=b32 -F euid=0 -S execve
And also make sure pam_loginuid.so is enabled in /etc/pam.d/sshd (default in Ubuntu 14.04).
In this way, all processes with euid 0 will be audited and their auid (audit user id, which represents the real user before su) will be preserved in the log.
In order to apply the pam_tty_audit.so library to the sd_pam service running, you will need to reboot for these PAM changes to take effect. After you have rebooted, you can verify that the module has been loaded with the following commands:
- ps aux | grep pam
- lsof -p <pid> | grep pam_
# ps aux | grep pam

admin 8015 0.0 0.0 113992 2636 ? S 13:21 0:00 (sd-pam)
root 8506 0.0 0.0 14852 1028 pts/0 S+ 13:23 0:00 grep –color=auto pam

# lsof -p 8015 | grep pam_

(sd-pam 8015 admin mem REG 8,1 10080 2156 /lib/x86_64-linux-gnu/security/pam_cap.so
(sd-pam 8015 admin mem REG 8,1 14576 2059 /lib/x86_64-linux-gnu/libpam_misc.so.0.82.0
(sd-pam 8015 admin mem REG 8,1 258040 2388 /lib/x86_64-linux-gnu/security/pam_systemd.so
(sd-pam 8015 admin mem REG 8,1 10376 2149 /lib/x86_64-linux-gnu/security/pam_umask.so
(sd-pam 8015 admin mem REG 8,1 10304 2148 /lib/x86_64-linux-gnu/security/pam_tty_audit.so
The ‘List System Open File’ (lsof) command dumps the loaded modules and the last module in the output above shows us that we have successfully loaded the pam_tty_audit.so module into our sd_pam service.
This gives us all of the neccasary system configuration we need to capture activity on our system merging both system activity with MITRE ATTACK TTP’s and PAM TTY user session activity.
Now we need to transition to setting up the OMS agent on the system to start collecting the audit log activity we just enabled and configured.
Configure OMS Agent to send audit.log data to Azure Sentinel
Here is the good news, the hardest part of this use-case is to set up your Linux environment. With that behind us, it is SUPER EASY to enable our OMS Agent to start sending the data we are capturing within the audit.log file of our Linux System. For this use-case I am making the assumption that you have already installed the OMS Agent on your Linux System. There are several ways an install of the OMS Agent happens:
- A manual install of the Agent
- Azure Security Center installed the Agent at the time of provision
- Agent provisioning during OEM ops build of your OS
No matter how you have your environment setup to install the OMS Agent please make sure you have your agent installed and configured to send events to the ALA Workspace your Azure Sentinel instance is attached to. If you need steps to follow for the agent install, please use this link: https://github.com/Microsoft/OMS-Agent-for-Linux/blob/master/docs/OMS-Agent-for-Linux.md
The configuration of the OMS Agent is super simple… You have 3 steps to complete:
- Copy the /etc/opt/microsoft/omsagent/sysconf/omsagent.d/auditlog.conf file to the /etc/opt/microsoft/omsagent/<WORKSPACE_ID>/conf/omsagent.d/ directory
# cp /etc/opt/microsoft/omsagent/sysconf/omsagent.d/auditlog.conf /etc/opt/microsoft/omsagent/<WORKSPACE_ID>/conf/omsagent.d/
- Restart the OMS Agent:
# sudo /opt/microsoft/omsagent/bin/service_control restart
- Check OMS Agent log for Agent Restart
# tail /var/opt/microsoft/omsagent/<workspace id>/log/omsagent.log
The output of the tail should look like the following:
2020-01-29 14:03:52 +0000 [info]: INFO Following tail of /var/log/audit/audit.log
2020-01-29 14:03:57 +0000 [info]: INFO Received paths from sudo tail plugin : /var/log/audit/audit.log, log_level=info
2020-01-29 14:03:57 +0000 [info]: INFO Following tail of /var/log/audit/audit.log
2020-01-29 14:04:02 +0000 [info]: INFO Received paths from sudo tail plugin : /var/log/audit/audit.log, log_level=info
2020-01-29 14:04:02 +0000 [info]: INFO Following tail of /var/log/audit/audit.log
With the validation of the audit.log data within our omsagent.log, we can now start to work with the data within Azure Sentinel.
Building Custom Analytics in Azure Sentinel
Ah, you should be patting your self on the back at this point for a job well done. You have the data configured and you are capturing the audit.log data into Azure Sentinel. So, what kind of Analytics can we build with this data? This is an exciting question to answer… here are my thoughts.
For this particular use-case, I thought about how the pam_tty configured data and the auditd data compliment each other. To start, I started with a simple query:
LinuxAuditLog_CL
| where TimeGenerated >= ago(1h)
| where Computer == “LinuxServerApp1”
| where a0_s == “netstat” and a1_s != “”
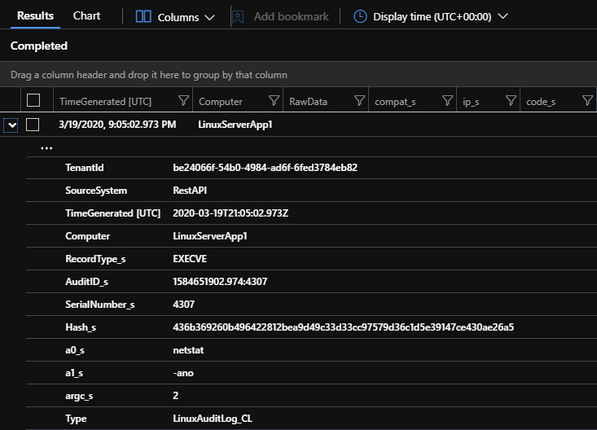
I used the ‘netstat’ command on my ‘LinuxServerApp1’ machine to test my configuration and make sure that the OMS agent was collecting the /var/log/audit/audit.log with my pam_TTY configuration trapping each command and key stroke. Feel free to test with any Linux command of your choosing. Now that I have this data being effectively collected, I can now start to put monitoring in place.
As I have mentioned before, this use-case is a handy for businesses who run production Linux servers that want to track and monitor all activity. To start with, we will want to take a look at how ‘auditd’ records activity. This activity is logged under “RecordType_s” == “EXECVE” and is stored in the “a0_s” field with its supporting attributes found in the corresponding fields: “a0_s”, “a1_s”, “a2_s”, and so on…
LinuxAuditLog_CL
| where TimeGenerated >= ago(4h)
| where RecordType_s == “EXECVE”
| where a0_s in (‘vim’,’vmstat’,’lsof’,’tcpdump’,’netstat’,’htop’,’iotop’,’iostat’,’finger’,’apt’,’apt-get’) and a1_s != “” and a2_s !in (‘update’,’dist-upgrade’,’-qq’)
| extend ConsoleCommand = strcat(a0_s,” “,a1_s,” “,a2_s,” “,a3_s)
| where ConsoleCommand !contains “apt-get -qq”
| project TimeGenerated, SerialNumber_s, Computer, RecordType_s, ConsoleCommand, a0_s, a1_s, a2_s
That being said, there is a lot more data we need to identify and then join it together. The great thing about they way this data is audited and logged is through a “Serial” number. So we will use that to join the rest of the auditd “RecordType_s” data sets together. Lets see what that will look like:
LinuxAuditLog_CL
//| where TimeGenerated >= ago(1h)
| where RecordType_s == “EXECVE”
| where a0_s in (‘vim’,’vmstat’,’lsof’,’tcpdump’,’netstat’,’htop’,’iotop’,’iostat’,’finger’,’apt’,’apt-get’) and a1_s != “” and a2_s !in (‘update’,’dist-upgrade’,’-qq’)
| extend ConsoleCommand = strcat(a0_s,” “,a1_s,” “,a2_s,” “,a3_s)
| where ConsoleCommand !contains “apt-get -qq”
| project TimeGenerated, SerialNumber_s, Computer, RecordType_s, ConsoleCommand, a0_s, a1_s, a2_s
| join kind= inner
(
LinuxAuditLog_CL
| where RecordType_s in (‘USER_START’,’USER_LOGIN’,’USER_END’,’USER_CMD’, ‘USER_AUTH’, ‘USER_ACCT’, ‘SYSCALL’, ‘PROCTITLE’, ‘PATH’, ‘LOGIN’, ‘EXECVE’, ‘CWD’, ‘CRED_REFR’, ‘CRED_DISP’, ‘CRED_ACQ’)
| project TimeGenerated, RecordType_s, SerialNumber_s, audit_user_s, user_name_s , tty_s, success_s
)
on SerialNumber_s
| summarize makeset(RecordType_s1), makeset(tty_s), makeset(success_s), User = makeset(user_name_s), AuditUser = makeset(audit_user_s) by TimeGenerated, SerialNumber_s, Computer, RecordType_s, ConsoleCommand
| extend User = tostring(User[0]), Audit_User = tostring(AuditUser[0])
| extend HostCustomEntity = Computer
| extend AccountCustomEntity = Audit_User
| extend URLCustomEntity = ConsoleCommand
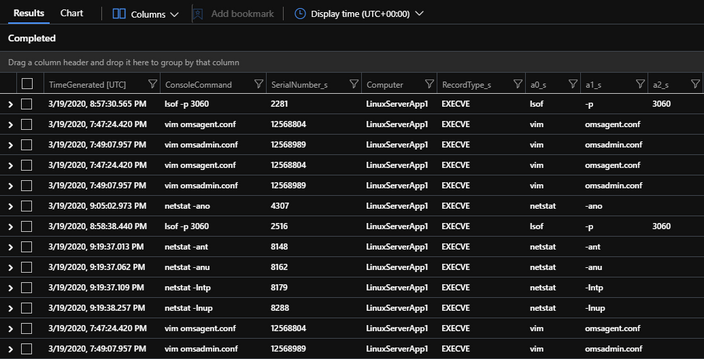
This KQL query brings all the goodness we have configured together through the “SerialNumber_s” field and joins our previous query to our second query where we are looking up associative data by “RecordType_s” and then throws the data sets into a makeset array to keep each command and its associative properties on a single line, introducing aggregation through our KQL query. When we run this query within Sentinel, we get an output that looks like this:
As you can see the data is aggregated to a single line and the other RecordType’s are stored in the makeset array, [“SYSCALL”,”EXECVE”,”CWD”,”PATH”,”PROCTITLE”].
Lets put the finishing touches on this and create a custom Analytic within Azure Sentinel for this to start monitoring all SSH/PAM_TTY activities. We can do that by using the +New alert rule tab near the top of our log UI.
When we push our KQL query to a new alert, we should see the following output:
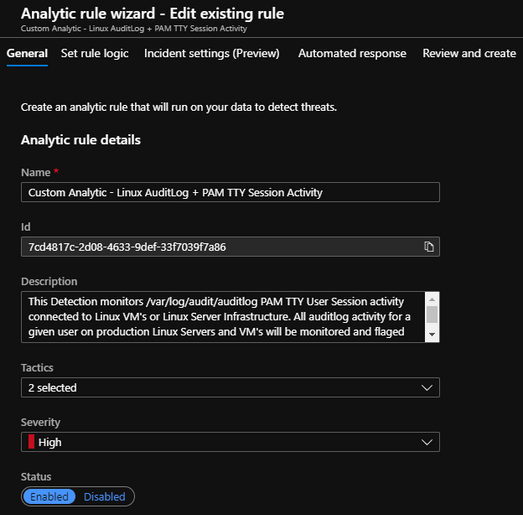
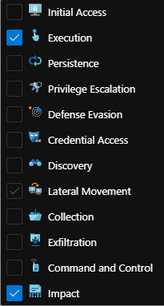
Now the above screenshot has a lot more information filled out because I have already gone ahead and tailored mine with a custom name and description and mapped it to the MITRE ATT&CK Tactics that are applicable. So let me add those settings for you down below:
Name
Custom Analytic – Linux AuditLog + PAM TTY Session Activity
Description
This Detection monitors /var/log/audit/auditlog PAM TTY User Session activity connected to Linux VM’s or Linux Server Infrastructure. All auditlog activity for a given user on production Linux Servers and VM’s will be monitored and flagged for review.
Tactics
Severity
With those filled out, lets move on to the meet of the detection.
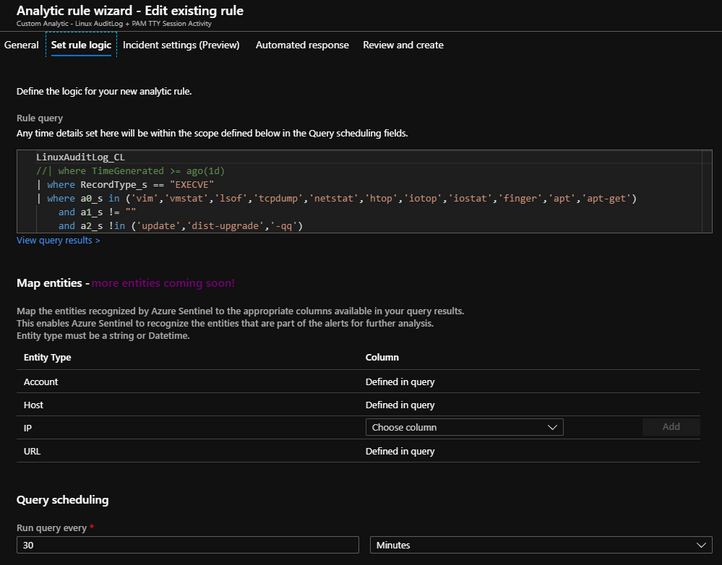
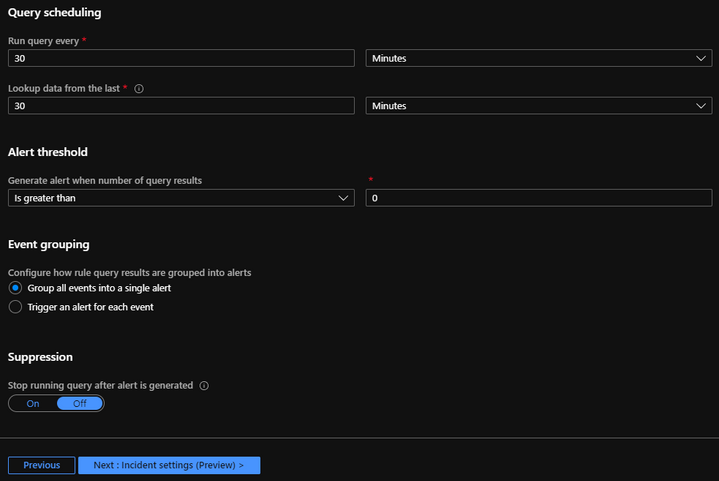
You should already see that the Query is in place for you and that the Map entities are already defined in the KQL query. Now I set my run time for every 30 minutes, but this is something you can adjust as needed.
I also have a corresponding data lookup set to 30 minutes that works with the query run. This is important because I only want to look up 30 minutes worth of data every 30 minutes keeping the run and the query time bound to 30 minutes. Then I have a threshold I set to “Is greater than” “0”. This depicts that I want all data I returned from my query, where my results are greater than 0. For this Alert, I have chosen to group all events into a single alert, but again you may want to play around with the aggregation options which brings us to our next section: “Incident Settings”.
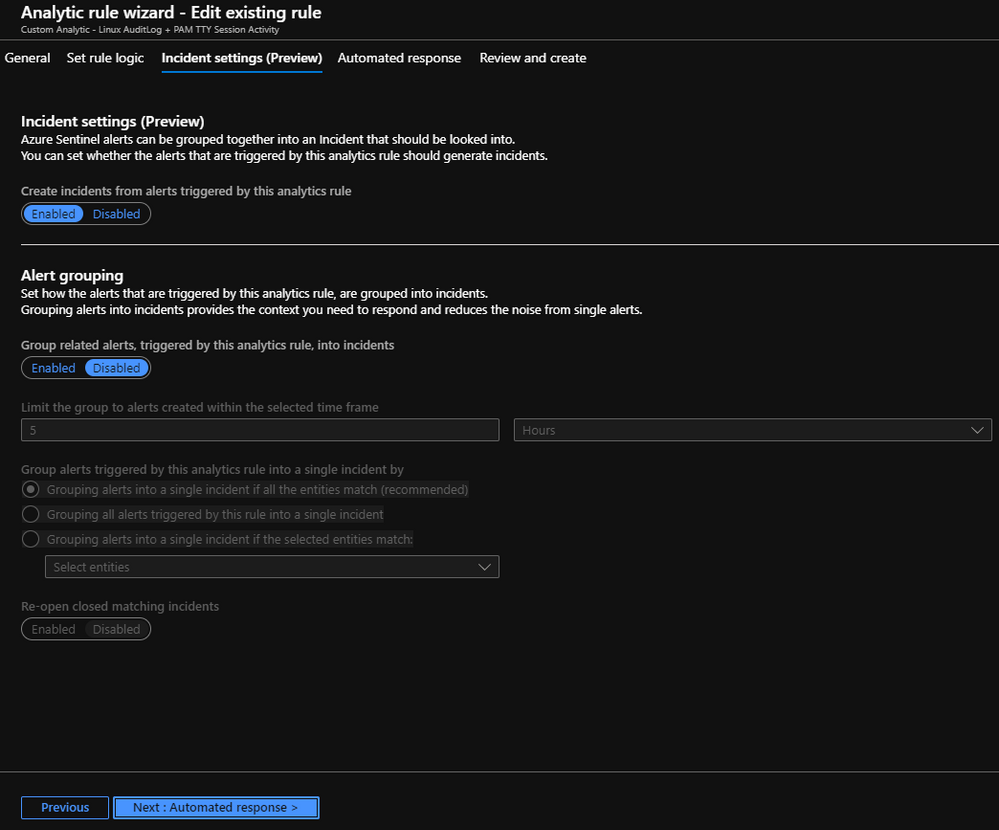
Again, feel free to play with these settings, but as you can see I have the default chosen.
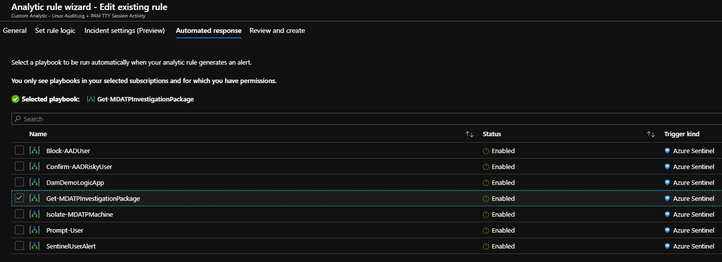
For the next section, “Automated Response”, we can choose the playbook we want to fire off when we Alert on the activities being monitored.
One of Azure Sentinel’s greatest strengths is its ability to integrate with 1st Party and 3rd Party tools. As you can see in this screenshot, I have chosen to “Get-MDATPInvestigationPackage” when I see command line activity on these Linux Servers to validate that the activities are legit. “Trust but Verify” is the assume breach mentality and with Sentinel’s SOAR capabilities, I can kick off an investigation package and have that data available for my analyst to go and review drastically reducing the time to investigate.
Our last step in this detection creation process is to Review / Validate and Create.
Now that our detection has passed validation, lets go ahead and finish the creation process by clicking on the Save button.
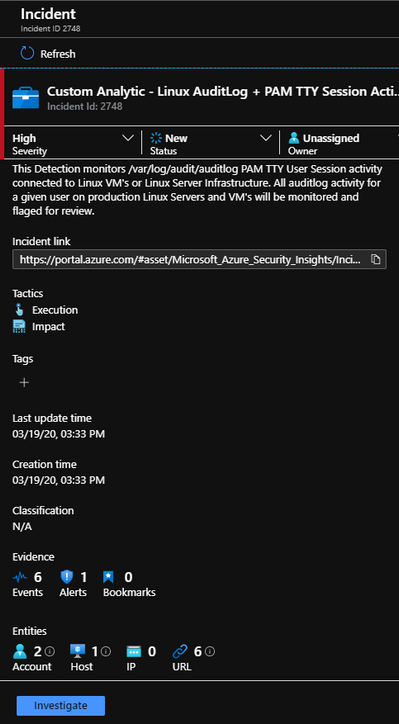
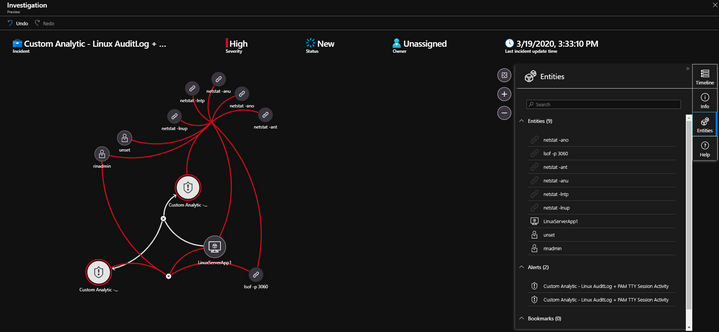
With our Detection in place, its time to go and look to see if we have any Alerts with corresponding Incidents. As it turns out, we do… Lets click on the Investigate button to see how Sentinel tied all of the hosts activities together.
Ok, Sentinel built the relationship between the Linux user, the commands run, and the host they were executed on all together for us to review.
We can see that using the OMS agent with SSH/PAM_TTY configured with /var/log/audit/auditlog we not only trapped all of the commands we were monitoring for, but it kept the user context even though these commands were run as the “root” user. This gives us great visibility into who executed these commands as the “root” user with out losing that context during the execution of any commands.
I hope you have found this Blog to be helpful as you stand up and monitor your Linux infrastructure within Azure Sentinel. Until Next Time!

