This post has been republished via RSS; it originally appeared at: New blog articles in Microsoft Tech Community.
The Time Series Model (TSM) within Azure Time Series Insights Preview enables IoT architects to create custom models to contextualize IoT telemetry data. Using these models, end users can compute, correlate, explore, and analyze their IoT telemetry data to gain valuable business insights.
This article steps through high-level features and benefits of TSM, discusses its three components, and provides a quick tour of the models used in two different environments: a proof-of-concept smart campus for Microsoft's own corporate headquarters, and the Contoso Wind Farm demo environment.
Key features and benefits
Times Series Model data stored in Azure Time Series Insights Preview. Below are key features and benefits.
- Defines the hierarchy of IoT telemetry data. Using TSM, users can assign their tags (or sensors, depending on your industry) to one or more hierarchies. In a facilities management solution, for example, telemetry data can be organized in a hierarchy so that temperature, pressure, and air flow measurements are all placed within a specific room. Multiple rooms can be within a level. Multiple levels can be within a building. Multiple buildings can be within a campus. When users explore their IoT telemetry data from within the Azure Time Series Insights Preview Explorer, a relevant hierarchy makes the data easier to explore . Modeling tags or sensors is important for different individuals in an organization to get meaning and value needed for their role. For example, a facilities service engineer might be intimately familiar with what the value of tag "DMPR" (damper—a plate that regulates air flow in a variable air volume control (VAV) system) means and how to respond. However, a regional manager might instead need an aggregated view. An IoT architect can model a solution with Times Series Model so that individuals with different roles within a company will understand the meaning.
- Enables comparison, correlation, or computation of IoT data. Because TSM stores context data with telemetry data, users can compare or correlate data. For example, a facilities operations manager can configure a model to view air handling units across multiple building sites. Or the manager can correlate the temperature change in a room with the number of people meeting in the room each hour of the day. Business decision makers can gain valuable insights by asking broad questions about their businesses. A model can also be setup to apply aggregate or scalar computations to tags of similar types.
- Reduces cost. TSM stores contextual information. This means that contextual data no longer needs to be stored within the payload of each telemetry message sent to your TSI environment. By reducing the payload size, the cost of Azure services goes down.
Components of Azure Time Series Model
- Instances Time Series Model instances are digital representations of the device emitting time series data. Instances have descriptive information associated with them such as a time series ID, type, name, description, hierarchies, and other instance fields.
- Hierarchies Time Series Model hierarchies organize instances by specifying property names and their parent-child relationships. They could be a spatial topology such as the physical lay-out of a building or a semantic hierarchy in which relationships are defined and visualized.
- Types Time Series Model types help define variables or formulas for doing computations. Types are associated with a specific Time Series Insights instance, and an instance can only have one type. A type can have one or more variables. For example, a Time Series Model instance might be of type Temperature Sensor, which consists of the variables avg temperature, min temperature, and max temperature. Using type variables, you can compute and visualize a derived time series. For example, a measurement could be multiplied by a value to do a unit conversion and then visualized in the explorer.
Two quick tours
Let’s take a quick tour of two different Time Series Models and see how they make it easy to explore IoT data. First, we’ll go through Microsoft’s own Smart Campus proof-of-concept and then move to the Contoso Wind Farm Demo.
Smart Campus
We ran a proof-of-concept using Azure Time Series Insights Preview to ingest and store heating, ventilation, and air conditioning (HVAC) data from two of our main campus buildings—building 121 and building 19.
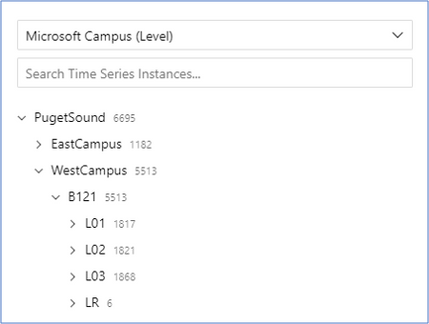
From Azure Time Series Preview explorer, we can conveniently look at the model from two views. The first (Fig. 1), displays the data from an equipment-centric perspective. You can see the power meter listed as a child under Building 121. The second hierarchy (Fig. 2), displays the data from a physical topology perspective. You can see floor level 1, level 2, etc. listed as children of Building 121.
 Figure 1 Equipment-Centric Hierarchy

 Figure 3 Exploring Instance Device_1210110_AV_9
After receiving an alert, an operator might come to the Azure Time Series Insights Preview explorer to get more data. For example, a damper “stuck closed fault” would go off if this damper is commanded open, but the sensor value indicates that it’s closed. This could indicate an obstruction of the damper, or a faulty motor. An operator might come to the explorer to get a visual of how long this has been an issue and to understand if this unit has experienced problems in the past. He or she could also use the level hierarchy to compare damper positions in other rooms to see if this is anomalous.
 Figure 4 Comparing damper positions on different units
We can switch to model view by clicking on the three-dimensional box on the left side of the user interface. From here, we use the Azure Time Series Preview Explorer to look at the instance Device_1210101_A1_10. In Fig. 5 below, we see the hierarchies it’s associated with, its type, as well as its name fields and values.
 Figure 5 Device_1210110_AV_9 instance field names and values
 Figure 6 Instance definition
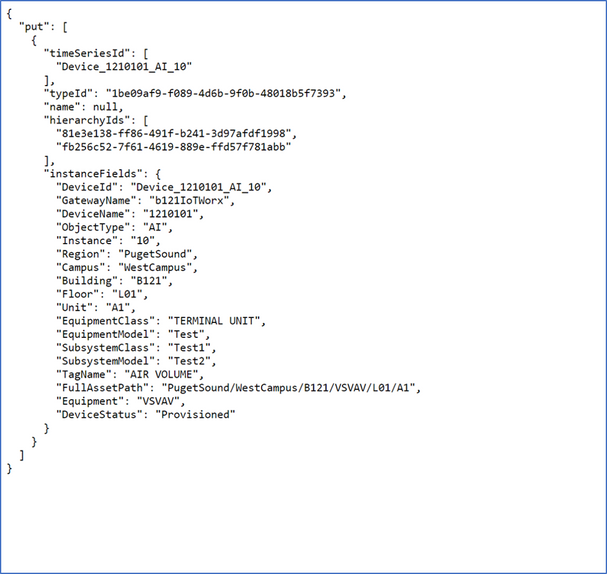
Notice that we can also view the underlying JSON code by clicking on “View JSON.” See Fig. 7 below.
 Figure 7 Underlying JSON Code
In the explorer we also have the option to bulk-edit instances. This enables associating hundreds of instances a new hierarchy or updating the type in one action.
 Figure 8 Bulk editing instances
 Figure 9 View a Type within the Model
 Figure 10 JSON Code
Contoso Wind Farm
 Figure 11 Contoso Wind Farm Model
 Figure 12 Edit Time Series Lanes
 Figure 13 View Multiple Time Series Simultaneously
IoT architects use Azure Time Series Model to add context to IoT telemetry data, to organize data, and to define custom computations so users can gain business insights by comparing and correlating information. Users can explore data within the model from the Azure Time Series Explorer or they can visualize the data by building their own application on top of the Azure Time Series platform.

