This post has been republished via RSS; it originally appeared at: Microsoft Teams Blog articles.
With the global crisis of COVID-19 and the impact on the global workforce, the ability to see utilization metrics from an external standpoint (for example: a user working from home) has become increasingly important for Teams IT Admins.
To see network information broken down between internal/external networks and to take full advantage of the Advanced Call Quality Dashboard (CQD) data, Microsoft highly recommends that a Building Data File be created and uploaded. Out of the many reasons for uploading the data file, one key piece of information relied upon is this delineation between internal networks (deployed and managed by organization IT admin) and external networks (managed by end-users or a private entity, such as: coffee shops). Knowing the call volume, call quality & reliability on the organization network (wired or WiFi) is important, as this is within the organizations sphere of control. Uploading a building data will expedite the organization IT admin in locating where problems occur in a specific region/site/location/building/floors of interest during call quality and reliability troubleshooting. External networks are managed by home users or private entity (such as a coffee shop owner). There is little action to occur on this front, other than providing recommended connectivity practices to the end users.
In keeping with the spirit of “Empowering every person and organization on the planet to achieve more” Microsoft has undertaken an effort to help those organizations currently lacking a building data file. By leveraging a third-party ISP/IP location database in conjunction with the reflexive IP address associated with a user, an approximate location can be determined to differentiate internal and external connectivity. Do keep in mind that the published/downloadable Microsoft Call Quality Power BI connector and associated Power BI templates work best when building data is provided.
To visualize the locations of home users in CQD Power BI, follow the steps below. This guidance will help identify the locations and ISP providers via 3rd party Geo IP databases. This example is provided for instructional purposes. It is up to you to follow any laws or regulations that might apply to mapping locations of your users based on their IP addresses.
Download IP addresses from an IP address database.
If your organization already has a subscription to an IP Geolocation Database, this may be used if it has the required information in it.
If not, search for an IP Geolocation Database and download it. This may require signing up for an account with the third-party providing the database.
One such provider is https://lite.ip2location.com. But you could download similar data from any other database for other reasons. Note that the accuracy of your results will depend on the precision of the IP-to-location data set.
After extracting the contents from the ZIP file, open the CSV file to see contents like the screenshot below.
Note: Query times may be optimized by filtering out extraneous data from the CSV. For example, if your organization only operates out of the United States, all other countries can be excluded.
IP Database Preparation
Columns A and B in the above example are the IP ranges (start and end) represented in a decimal format. These do not look like traditional IP addresses and will need to be converted to a more recognizable format.
The formula to use in this instance is as follows:
= CONCATENATE(INT(A1/(256*256*256)),".",INT(A1/(256*256))-INT(A1/(256*256*256))*256,".",INT(A1/(256))-INT(A1/(256*256))*256,".0/24")
- Copy formula from the equal sign to the end of the line.
= CONCATENATE(INT(A1/(256*256*256)),".",INT(A1/(256*256))-INT(A1/(256*256*256))*256,".",INT(A1/(256))-INT(A1/(256*256))*256,".0/24") - Paste the copied formula into cell G1.
- Select column G, click the “Fill” button and select “Down.
- It will then convert the values from column A to IP address ranges. A small sample is shown below.
Save the file (IPLOCATION.CSV) to keep maintain the converted IP ranges. These columns are the foundation that will provide the best effort relative location without building data being uploaded. At this time, everything is simplified with a 24 bit mask. We will continue to improve and expand the ranges out.
The next step is to associate the IP database with the Power BI Teams Utilization Report.
Import IP Data In PowerBI
Open the Teams Utilization Power BI report.
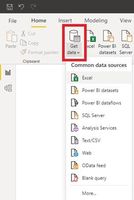
- Click on the “Get Data” option from the Home ribbon and select Excel.
- Browse to the directory of the IPLocations.csv file. Verify “All Files” is selected, then click Open.
When importing the data, the option to “Transform Data” is presented. Select this option.
- Columns can be removed or renamed as needed. Columns 3 through 8 will be renamed in this example.
- Click “Close & Apply” on the far left of the Home ribbon.
Accept the security warning prompt when it’s presented.
The IP location data can now be found under the data model in the Teams Utilization Power BI.
Joining Datasets in PowerBI
The final step in this walkthrough is to join the Direct Query and imported IPLocation datasets. In the modeling tab, select “Manage Relationships” found in the middle of the Home ribbon.
- Create a new many to one relationship between the CQD Data Source and your newly created IP table using the Second Reflexive Local IP in the Direct Query Table and the ReflexiveEnd column from IPLocations.
- Select “New”.
- Select the columns that will have the relationship created, and make it “Many to One(*:1)”.
- Click Ok when complete.
- Close the relationship management window.
The datasets are now joined and should be ready for use in Power BI visualizations.
Create Visualizations
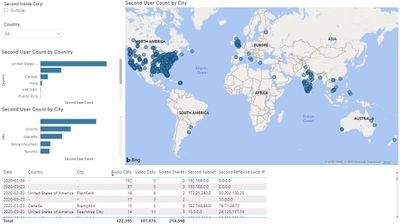
If the column names remain the same, the last tab of the Teams Utilization Power BI can be used as shown below.
If the column names changed during the database prep and import process, then the values will need to be changed for the visuals and slicers on the tab. If preferred, net new visualizations may be created as well.
By default, all information for all networks is displayed. Apply a page filter on second subnet for common home networks to visualize users at home.


