This post has been republished via RSS; it originally appeared at: Azure Database Support Blog articles.
Azure SQL Analytics collects and visualizes key performance metrics with built-in intelligence for performance troubleshooting.
By using these collected metrics, you can create custom monitoring rules and alerts. Azure SQL Analytics helps you to identify issues at each layer of your application stack. It uses Azure Diagnostic metrics along with Azure Monitor views to present data about all your Azure SQL databases in a single Log Analytics work-space. Azure Monitor helps you to collect, correlate, and visualize structured and unstructured data. More information can be found here.
Let us Begin:
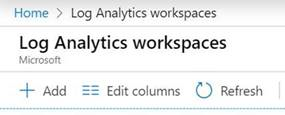
- From Azure Portal search field go to Log Analytics workspaces the click Add, please have a look at the following snapshot:
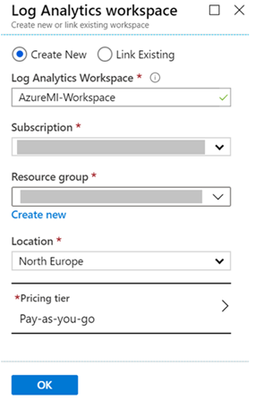
- Fill the values then click on OK, please have a look at the following snapshot:
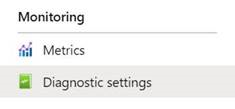
- Go to your Azure SQL MI that you want to create an alert for it, then click on Diagnostic Settings (Left-menu), please have a look at the following snapshot:
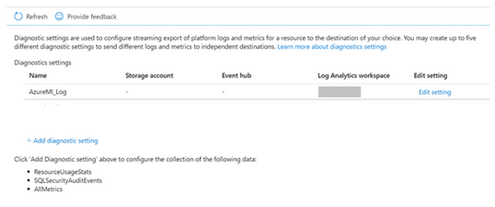
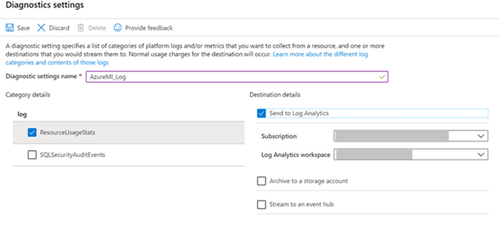
- From the right-side, click on the Add diagnostic setting and select the Log Analytics work space that you have created above then click on save, please have a look at the following snapshots:
- Click on the Log Analytic Workspace that we have created, please have a look at the following snapshot:
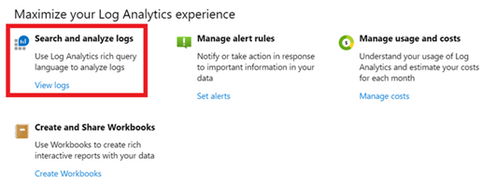
- From the right-side, click on view logs under Search and analyze logs, please have a look at the following snapshot:
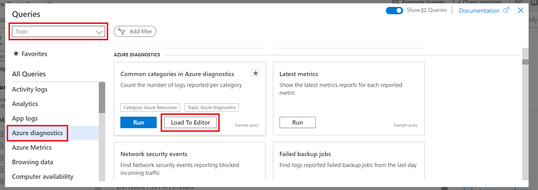
- From the Queries dialog, select Topic from the top-left drop down list then Azure diagnostics from All Queries and finally click Load To Editor, please have a look at the following snapshot:
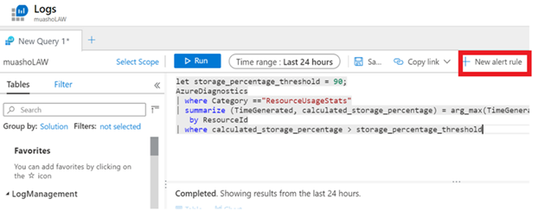
- Clear the editor and copy the query from here (This query is responsible on monitoring if Azure MI storage is above 90%) then paste it in the editor and click on New alert rule, please have a look at the following snapshot:
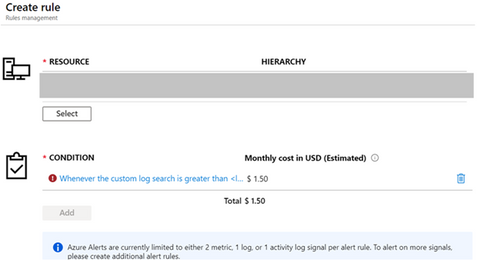
- An alert will be created using the above query, please have a look at the followings snapshot:
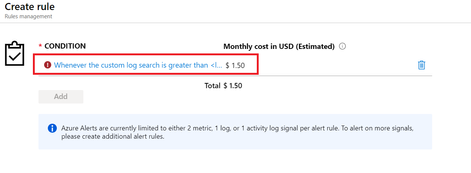
- Click on the condition that you want to add the threshold in, please have a look at the following snapshot:
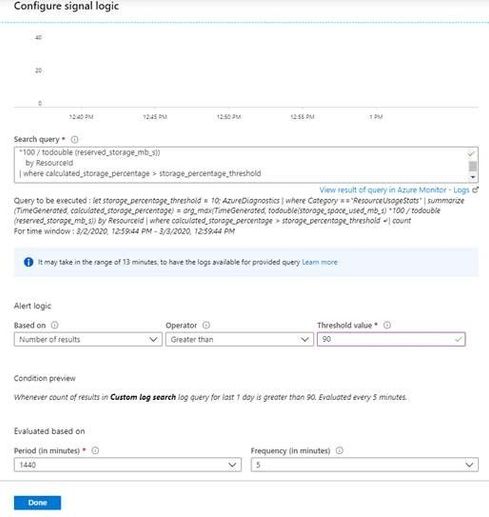
- Enter a specific threshold in the Threshold value field, then click Done, please have a look at the followings snapshot:
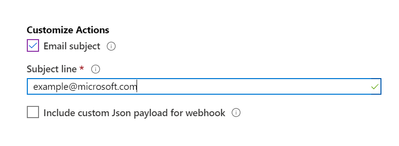
- In Customize Actions section, select the Email subject and enter your specific email, please have a look at the following snapshot:
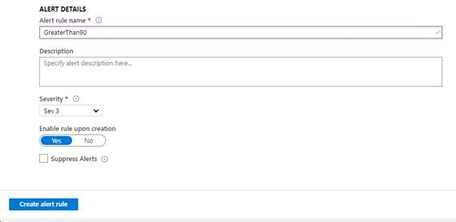
- In Alert Details section, fill alert rule name and description and finally click on Create alert rule button, please have a look at the following snapshot:
- To check if the alert created, from the portal search for Alerts then manage alerts, and you will find your created alert, please have a look at the following snapshot:
More information can be found in the following documents:
 Tutorial: Get started with Log Analytics queries
 Get started with log queries in Azure Monitor
