This post has been republished via RSS; it originally appeared at: New blog articles in Microsoft Tech Community.
Hello everyone, my name is still David Loder, and I'm still PFE out of Detroit, Michigan. And I have a confession to make. What you are about to read took me three revisions back and forth with my customer until we came up with a solution that worked. Each time I thought I was giving them full guidance on how to solve their problem, we hit another roadblock with things not working like we thought they should. Enjoy reading about the right way to solve this particular problem and keep challenging your PFEs!
When trying to track down an elusive Active Directory performance problem, gathering stats using the Active Directory Diagnostics Data Collector Set is the best method for insight as to what the Domain Controller is doing. However, having super busy DCs and not knowing exactly when the problem is going to occur can make capturing the data and generating a useful report harder. There are also limitations with the Data Collector Sets that we have to take into consideration to come up with a solution that really works.
Let me start with explaining how, and more importantly when, the various features of the Data Collector Sets work.
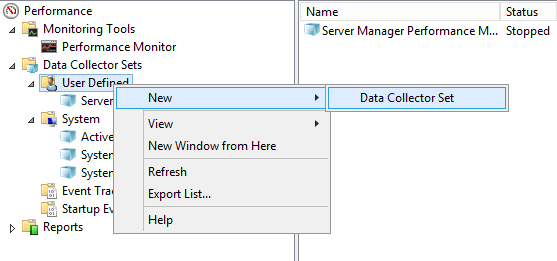
The first thing to know is that you cannot change the properties of the built-in System Data Collector Sets. You must create a custom User Defined Data Collector Set to be able to change its behavior. Create a new Data Collector Set by right-clicking the User Defined node and select New > Data Collector Set. Give it a name, create it from an existing template. Use the Active Directory Diagnostics as the template. Finish the wizard.
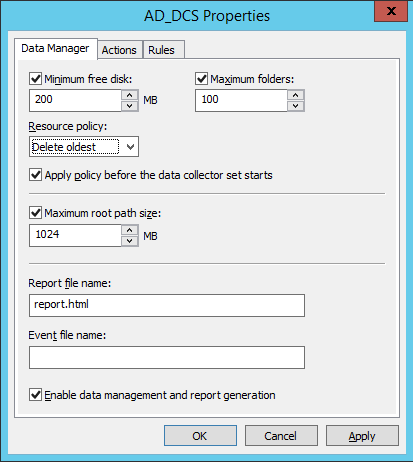
The DCS has settings that can be used to keep the collection from consuming too much disk capacity. Right-click the new DCS and select Data Manager Settings. The Resource Policy of Delete Oldest causes older folders to be deleted to keep from growing too large. You can adjust the size or folder count as needed. However, two things have to occur to have the data purging trigger. First, the “Enable data management and report generation” property has to be selected. It should be selected by default. But second, these Data Manager rules don’t trigger until the DCS stops. That’s an important distinction for the next set of DCS properties.
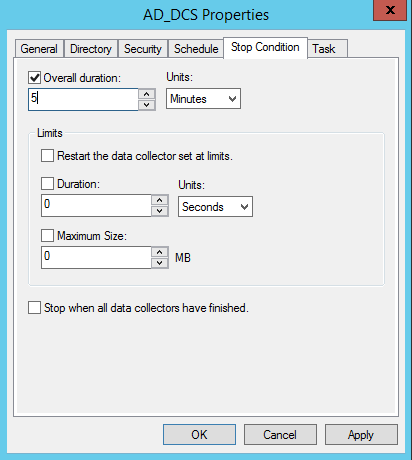
Now right-click the DCS, select Properties and switch to the Stop Condition tab. The Overall duration, which defaults to 5 minutes, controls when the DCS will automatically stop. Overall duration is the only setting that causes the DCS to stop on its own. The Limits section can be used to force the DCS to start using a new folder with new files for its collection, but setting a limit does not stop the DCS and therefore does not trigger the data purging configuration that is set in the Data Manager section.
The final feature of a DCS to explain is the report feature. Like data purging, report generation also only occurs when the DCS stops. Only the collection folder that was active when the DCS was stopped is used as the input source for the report. If you configure a limit and end up with multiple source folders for a single execution, only the last folder is used. Also, the size of the collected data in the collection folder determines how long the report generation will take. Larger source data results in longer report generation times. While the report is being generated, all data collection has stopped and that same DCS cannot be restarted. Other than the report name in the Data Manager section, there is no GUI for managing report definitions.
With this explanation for how a DCS works complete, I have a problem I had been trying to solve for a customer of mine. They had an elusive Active Directory performance problem that they couldn’t predict when it would happen, couldn’t cause it to happen on demand and it could be many days before it reoccurred. But they could tell when it had happened and wanted more diagnostic data for what the Domain Controller was doing at that time.
So, we needed our DCS to behave with the following characteristics:
- Continuously capture data over several days without gaps
- Do not save more data than the DC capacity
- Generate a report against an identified collection
The first problem to solve is how to collect data without gaps yet still allow purging to run. The solution is to allow the DCS to stop, so purging can happen, but not run a report when it does stop so we don’t waste capture time running a report against a time period that likely didn’t include the event we were trying to capture. There’s no GUI for the report definition. It’s located in the XML of the DCS itself. Right-click your custom DCS and select Save Template. Open the XML in notepad and find the ReportSchema node. You’ll see there are nine report definitions that are included. Delete all the Imports except one and change the file to a non-existent filename. Having one invalid Import for the report causes the smallest possible report to be generated, which finishes in a fraction of a second, minimizing the amount of time we’re not collecting data. Having zero Report Imports causes a default set of reports to run, which we want to avoid since they take time to finish. Save the edited content to a new XML file.
That section of XML should now look something like this:
<ReportSchema>
<Report name="wpdcAdvisor" version="1" threshold="9999">
<Import file="%systemroot%\pla\reports\NoReport.xml">
</Import>
</Report>
< /ReportSchema>
With this change to the XML complete, create a new DCS from a template, but this time browse to the edited XML file instead of selecting from the list.
For this new DCS, set the Data Manager purging rules as needed and clear the Overall duration checkbox for the Stop Condition. Now we have a DCS that we can start and when we stop it, it quickly stops, creates a very small, useless report and purges the oldest data. By clearing the Overall duration checkbox, this DCS will run until stopped by another method (manual or scripted). It will not stop on its own.
On my customer’s busy DCs we can’t let the collection run too long, otherwise there’s a chance a report can never be generated so our plan is to stop and start the DCS once an hour. The built-in scheduler on the DCS properties isn’t that great so we’ll use Task Manager instead. We created a small batch file with these commands:
logman.exe stop AD_DCS_NoReport
logman.exe start AD_DCS_NoReport
Then we created a task that ran under the SYSTEM account that ran that batch file once an hour.
After the event reoccurred, we knew what collection set the data should be in, so we needed to generate a report for that particular 1 hour block, which we have to do manually. In each DCS collection folder, you should see four files: Active Directory.etl, AD Registry.xml, NtKernel.etl and Performance Counter.blg. There is a fifth file that we need to generate the report. We will manually create it. Create a new text file in the folder called reportdefinition.txt. In that text file, add the following XML and save it.
<Report name="wpdcAdvisor" version="1" threshold="9999"><Import file="%systemroot%\pla\reports\Report.System.Common.xml"/><Import file="%systemroot%\pla\reports\Report.System.Summary.xml"/><Import file="%systemroot%\pla\reports\Report.System.Performance.xml"/><Import file="%systemroot%\pla\reports\Report.System.CPU.xml"/><Import file="%systemroot%\pla\reports\Report.System.Network.xml"/><Import file="%systemroot%\pla\reports\Report.System.Disk.xml"/><Import file="%systemroot%\pla\reports\Report.System.Memory.xml"/><Import file="%systemroot%\pla\reports\Report.System.Configuration.xml"/><Import file="%systemroot%\pla\Reports\Report.AD.xml"/></Report>
You may recognize that these are the same files that show up in the XML that we edited.
Finally, execute the following command line from within the capture directory you want to use for the report.
tracerpt.exe *.blg *.etl -df reportdefinition.txt -report report.html -f html
If everything went right, you should end up with a normal DCS diagnostic report that you can review which covers the time period from when the event occurred.
As a neat trick, if you need to see more than the top 25 items that the report defaults to, you can run the following command to get full XML output:
tracerpt.exe –lr "Active Directory.etl"
For additional reading on similar issues that led me to this solution, I offer up the Canberry PFE team blog Issues with Perfmon reporting - Turning ETL into HTML, the Directory Services Team blog Are your DCs too busy to be monitored?: AD Data Collector Set solutions for long report compile times or report data deletion and the Core Infrastructure and Security blog Taming Perfmon: Data Collector Sets.
Thanks for spending a little bit of your time with me.
-Dave


