Rule tuning for SIEM solutions is a delicate and continuous process of balancing between detecting threats and reducing alert noise. The more accurate and less noisy the rules are, the better the detections will be. To support this goal within Azure Sentinel, we are delighted to announce improvements to the “Preview Graph” feature now in public preview.
The Preview Graph runs a simulation against the last 50 evaluations of a scheduled analytic rule and outputs a graph indicating the average number of alerts that the rule generated based on the raw event data evaluated. This data can then help you tune your Azure Sentinel scheduled rules by predicting the average number of alerts the rule is expected to generate.
How to use the feature
To try out this feature, navigate to the Analytics blade in the Azure Sentinel Overview page and select an existing analytic rule.
Once you define the KQL query behind your rule you are now ready to get a preview of the results. To do so, click on the arrow next to “Test with current data”.
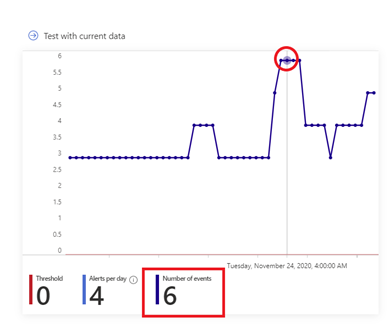
Upon evaluation of the last 50 runs of the analytic rule a graph similar to the one below will appear, giving you an indication of the level of alerts to expect if you were to use the evaluated configuration of the rule. On the Y-axis you have the number of events generated while on the X-axis you have the period of time within which the last 50 evaluations of the rule occurred. The “Threshold” value is obtained from the “Set rule logic” section of Analytic rule wizard and it is used to specify the number of query results needed to trigger an alert while the “Alerts per day” denotes the average number of alerts generated across the time period indicated on the x-axis for the last 50 evaluations of the rule.
To visualize the raw events at a specific point in time on the graph, hover over a particular data point and the graph will adjust to show you what the number of events was at that particular point in time and upon clicking on the point the Log Analytics query window will open and show you the actual events at that specific point :
Get started today!
We encourage you to use the new Preview Graph to improve the accuracy of your analytic rules and reduce alert noise.
Try it out, and let us know what you think!
You can also contribute new connectors, workbooks, analytics and more in Azure Sentinel. Get started now by joining the Azure Sentinel Threat Hunters GitHub community.


